Seasonality, the bitcoin halving, US elections and the FED rate cuts
Oct 3, 2024 - 8 min read
Wake me up when September ends
You’re likely familiar with the famous song by the American rock band Green Day, "Wake Me Up When September Ends." In the world of investing, particularly when it comes to U.S. stocks, this phrase holds meaning beyond just the song title.
In recent weeks, much has been said about the seasonality of both equities and bitcoin, and for good reason: August and September have historically been the worst-performing months for U.S. stocks and bitcoin.
Since 2010, the S&P 500 has averaged monthly returns of -0.56% in August and -1.15% in September. However, these two weak months are followed by the second- and third-strongest months, with October posting an average gain of +2.19% and November delivering +2.65%. Only July surpasses these, with an average return of +2.75%.
When we analyse the average monthly returns for bitcoin, we observe a notable similarity to the S&P 500. Bitcoin’s only months with negative average returns are also August, at -0.54%, and September, at -4.16%. These negative months are followed by two exceptionally robust months: In October, bitcoin boasts an average return of 29.88%, and in November, a striking 37.51%, making November its best-performing month. The spring months, especially April, also demonstrate strong performance, with an average gain of +36.29%, as illustrated in the following chart.
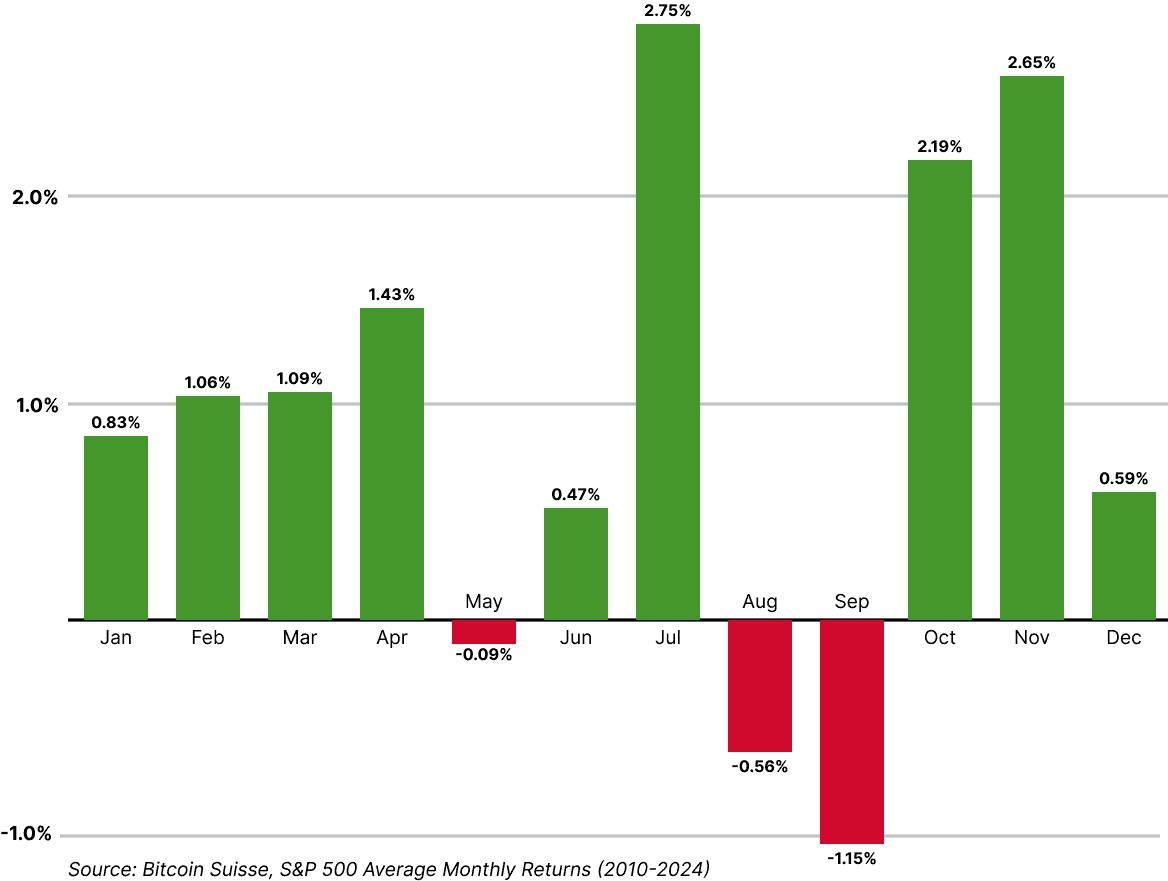
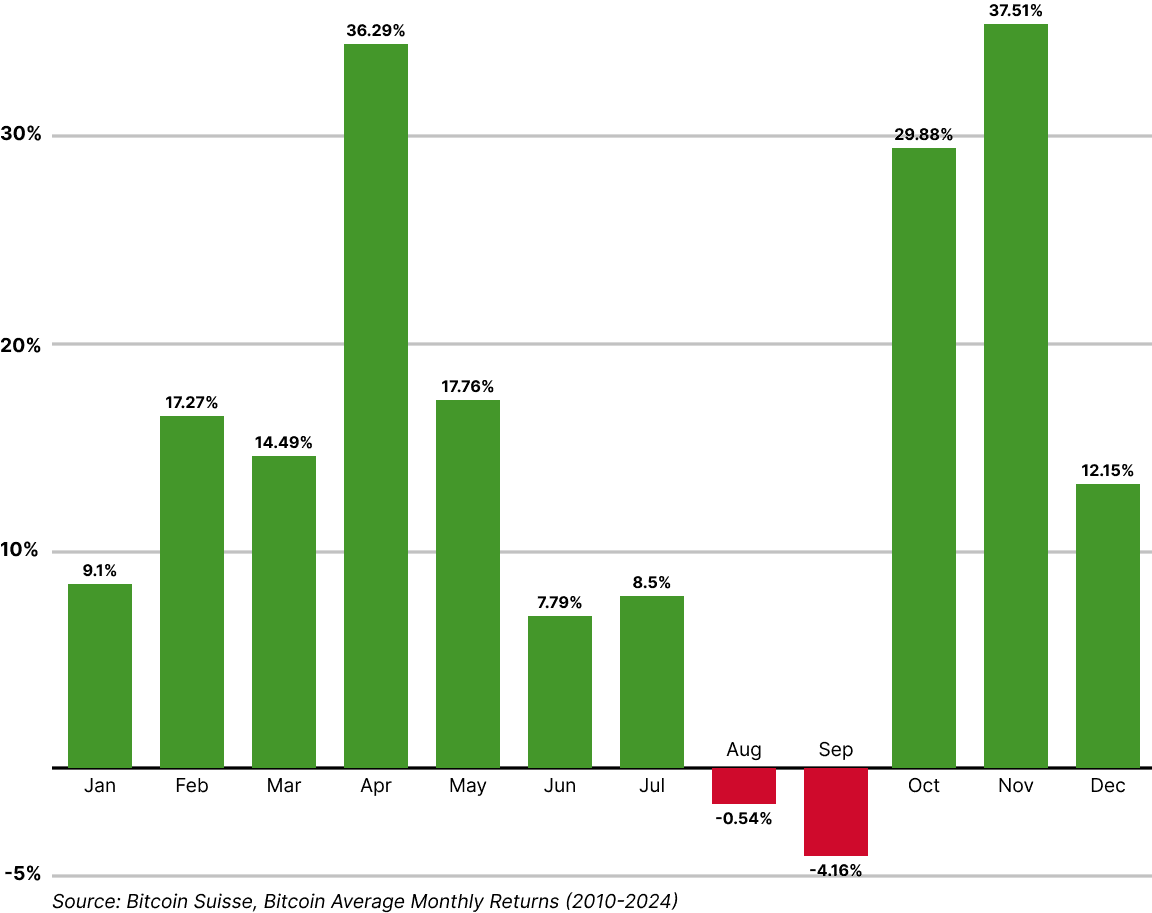
Sell in May and go away?
Interestingly, the chart above indicates that the well-known phrase "Sell in May and go away", which has circulated since the 19th century, has not proven particularly effective for investors in either the S&P 500 or bitcoin since 2010. A more appropriate phrase might be "Say Goodbye in July" only to return in September—echoing the industry wisdom "Remember to come back in September".
2024 – Anything but Normal
The seasonal trends discussed above offer a general overview for when investors and market participants might anticipate more volatile price movements, as well as when a more cautious, wait-and-see approach might be warranted. During the summer months, particularly August and September, many market participants take vacations, resulting in reduced trading volumes and lower market liquidity.
However, this year, August proved anything but tranquil. Recall early August, when the S&P 500 experienced a correction of nearly 10%, while bitcoin lost almost 30% in just a few days. Despite this turbulence, the S&P 500 concluded August with a modest gain of 2.28%, while bitcoin saw a decline of nearly 9%. In September the S&P 500 has climbed more than 1.5%, with bitcoin gaining 7.5%. Contrary to historical trends, the two weakest months have yielded positive results for the S&P 500, while bitcoin continues to trade below its August 1 price of $64,600.
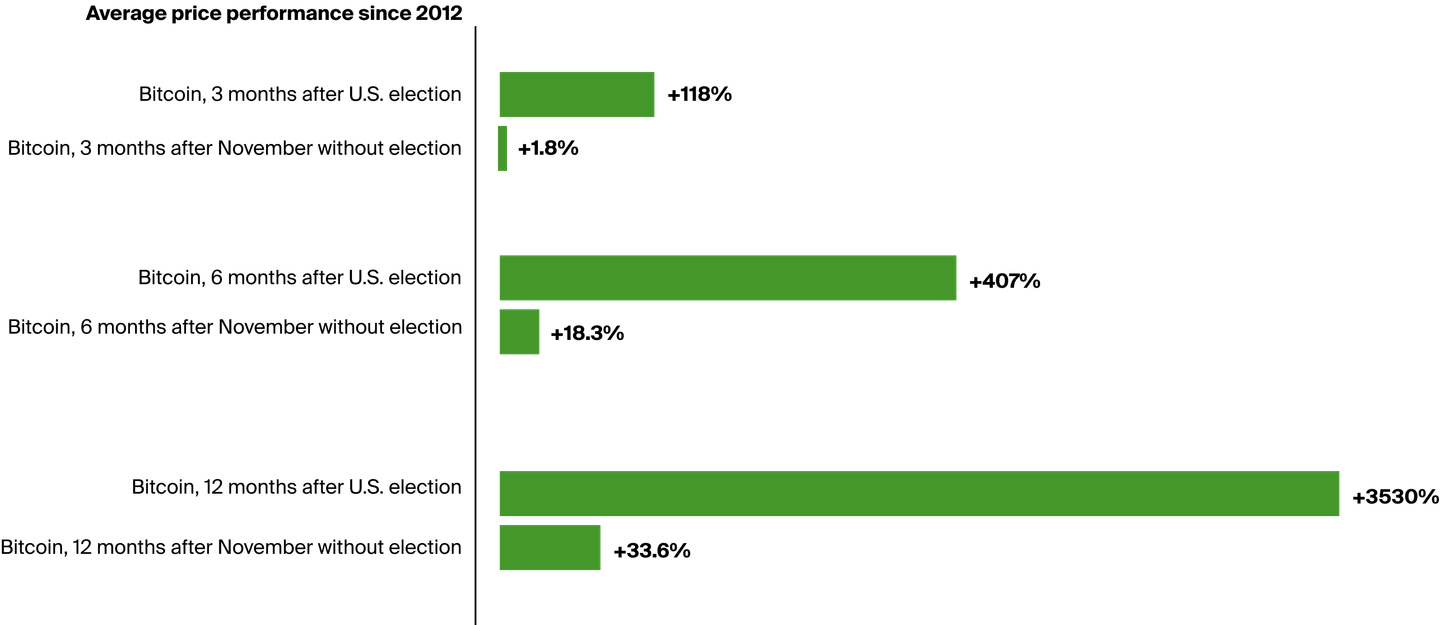
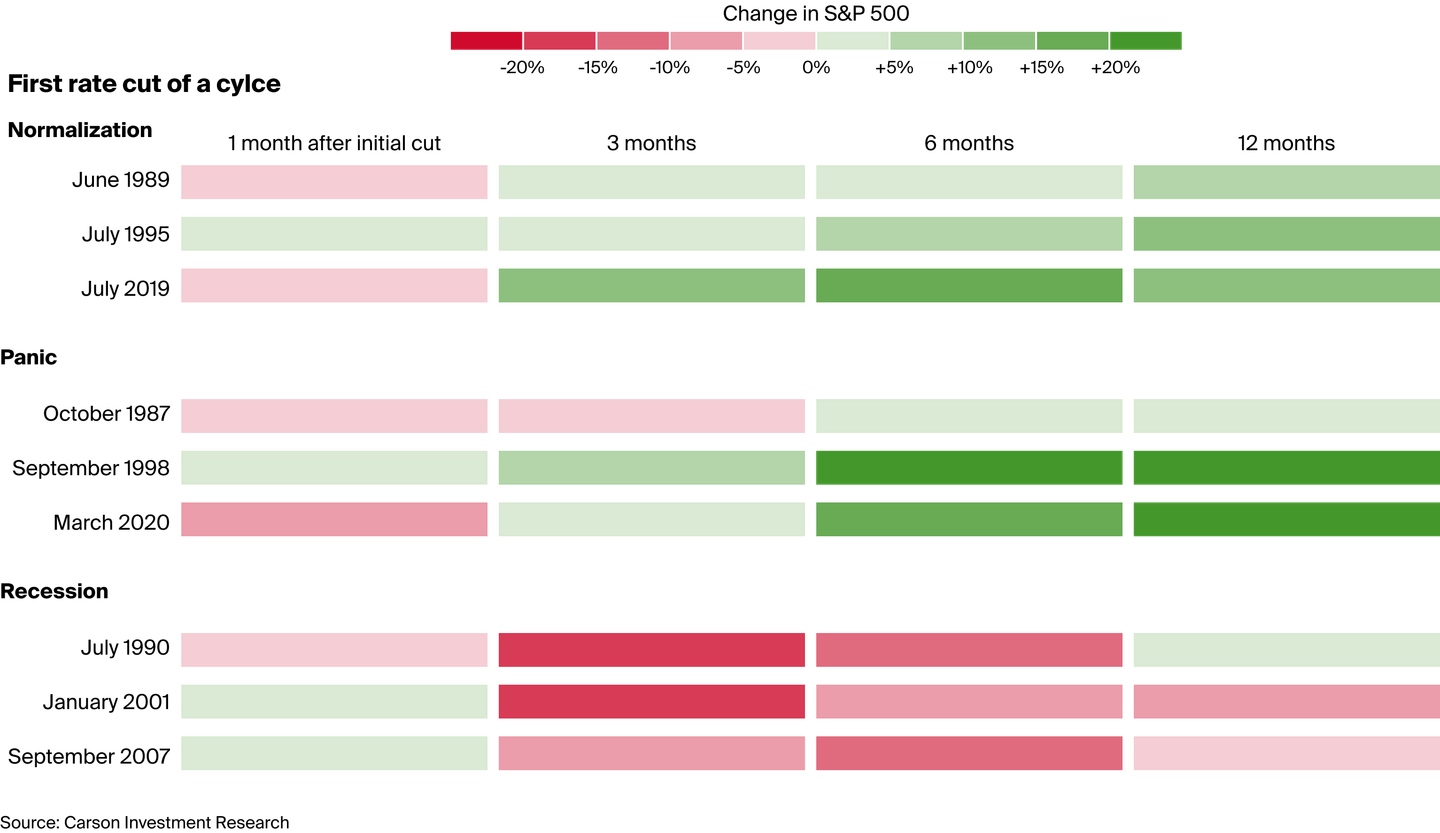
2024 is extraordinary for additional reasons. In November, the U.S. presidential elections will take place, with current President Joe Biden having withdrawn from the race over the summer, paving the way for his Vice President, Kamala Harris, to run against Donald Trump for the presidency. Additionally, the Federal Reserve cut interest rates in September for the first time since 2020, reducing them by a significant 0.5 percentage points.
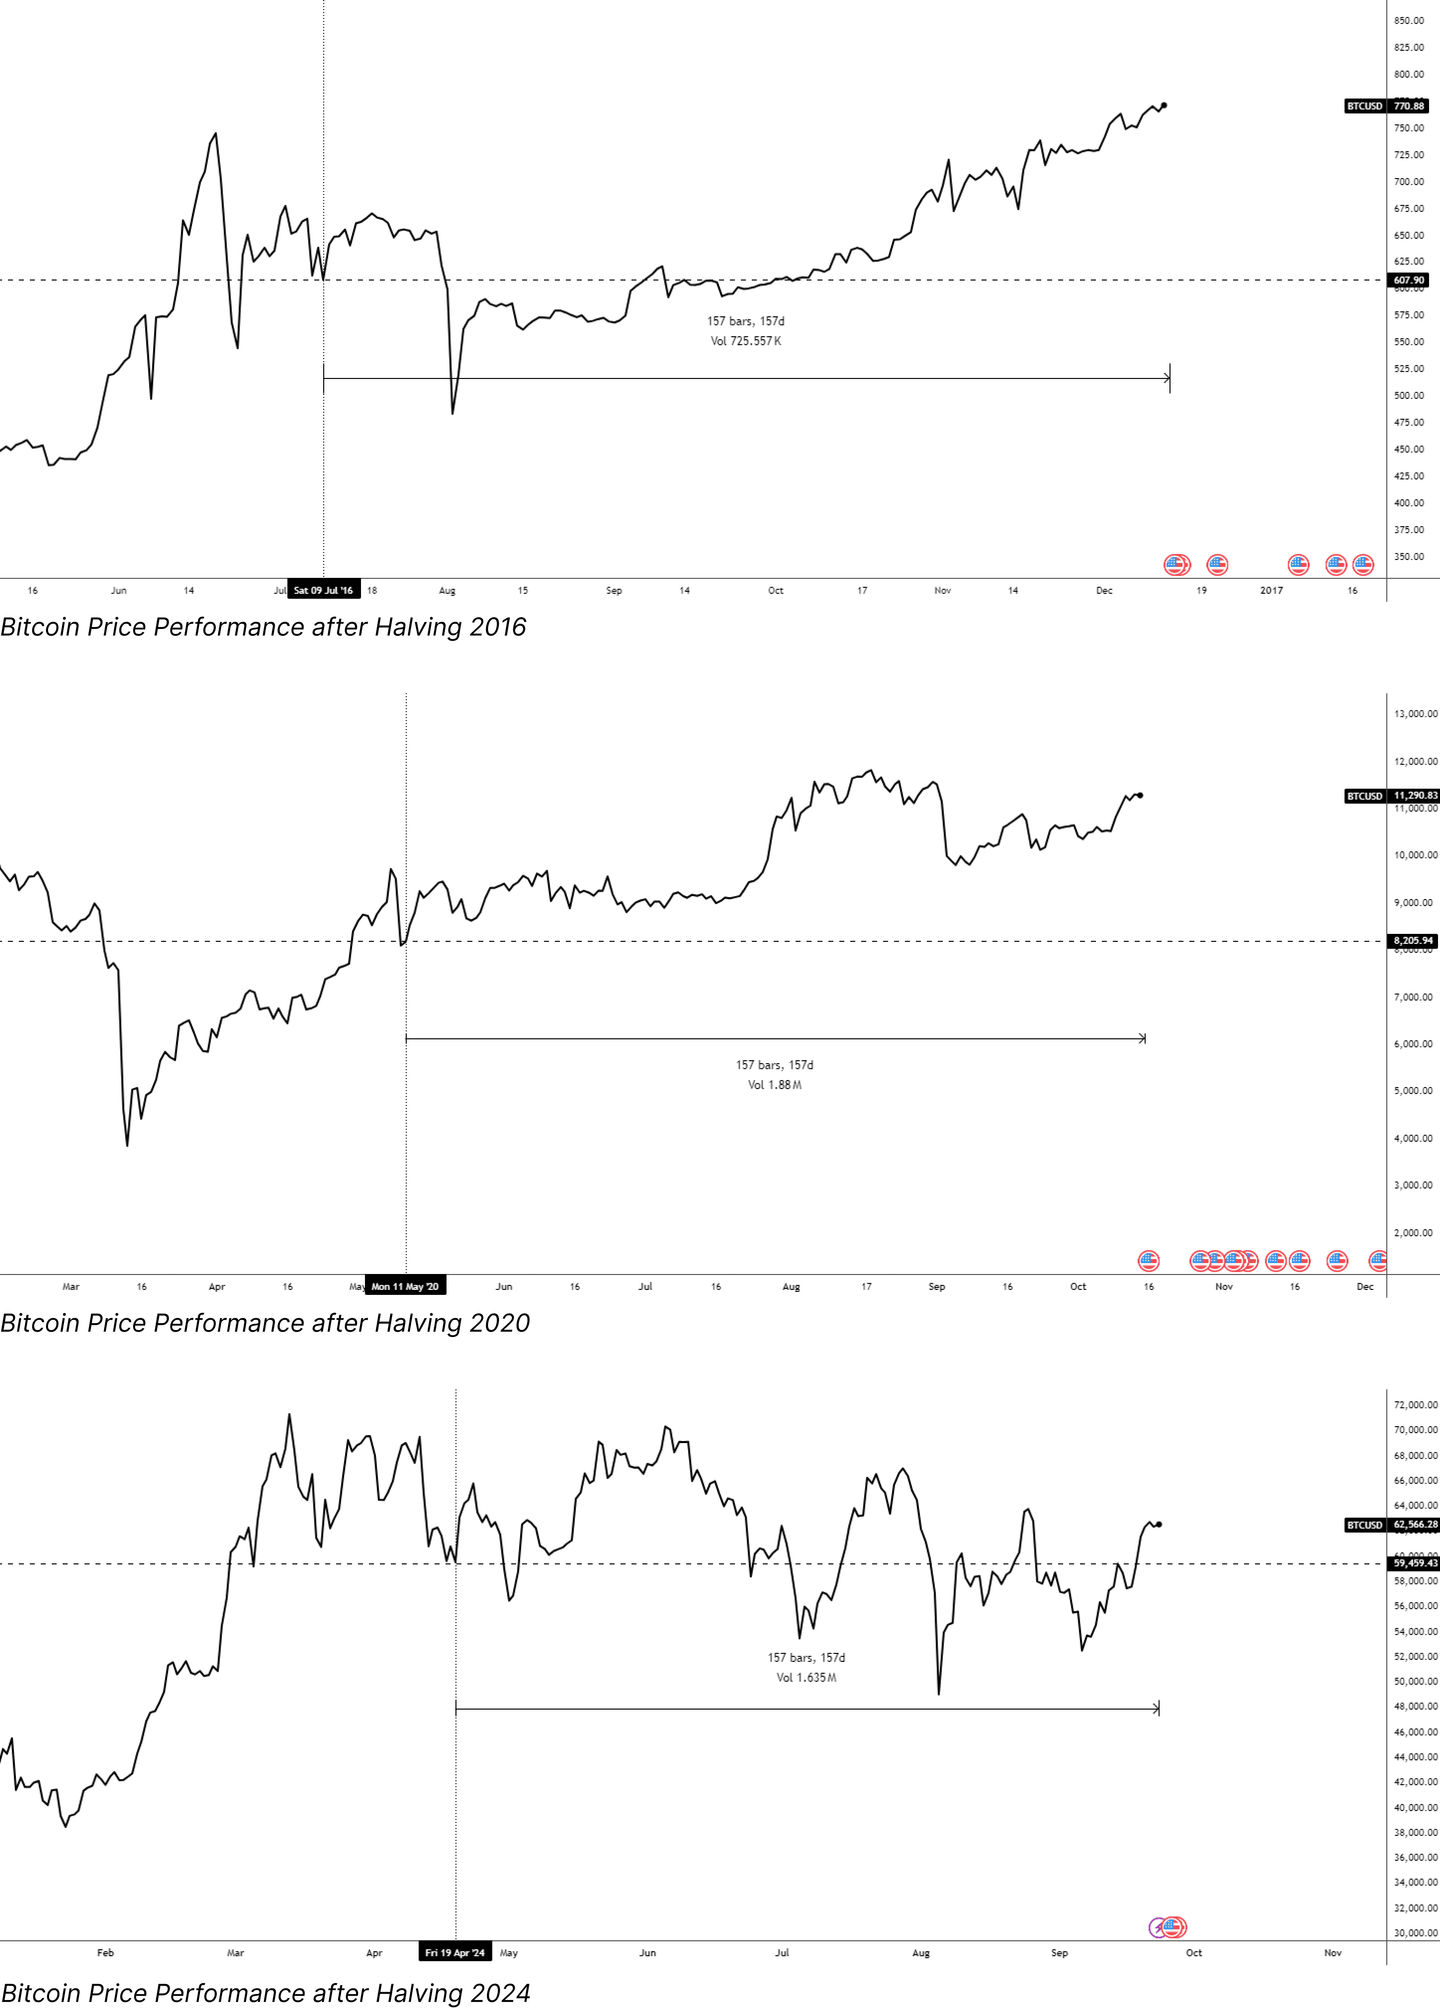
But that’s not all—2024 is also pivotal for bitcoin, as the fourth halving event occurred on April 19. Let’s delve deeper into how these developments might influence the price movements of risk assets like bitcoin and the S&P 500.
The bitcoin halving
On April 19, 2024, the fourth bitcoin halving took place. We have previously published several articles on this topic, which you can revisit for more context. In this section, we will compare bitcoin's price performance following previous halvings with its current performance in 2024, after the fourth halving. As mentioned earlier, seasonality plays a minor role in price movements; significant events and news—such as economic data and policy decisions—also exert considerable influence. The chart below illustrates bitcoin’s price performance following the halvings in 2016, 2020, and 2024.
In both 2016 and 2020, bitcoin experienced periods of sideways trading or even dipped below its halving price for a period after each event. Approximately 160 days following each halving, the price in all instances had risen above the halving level, although this year’s price difference is notably smaller than in the previous two halvings. In 2016 and 2020, substantial price rallies occurred later, particularly in the year following the halving—specifically in 2017 and 2021.
To illustrate, after the second halving, bitcoin surged from around $770 (approximately 160 days post-halving) to over $19’000 by December 2017. Likewise, following the third halving, bitcoin climbed from $11’000 (160 days post-halving) to $69’000 by November 2021.
However, it is essential to recognize that these are historical benchmarks, and past performance does not guarantee future results. Moreover, the 2024 halving is not the only significant event this year, as the U.S. is being in the midst of a presidential election. While much has been discussed regarding the performance of risk assets during election years, the pressing question remains: What can we expect in the year following the elections?
Analyzing price performance post-U.S. Presidential Elections
We have conducted an analysis of the price performance of bitcoin and the S&P 500 during the months following U.S. presidential elections, comparing it to price movements in November of non-election years. It is noteworthy that since 2012, the S&P 500 has significantly outperformed in the years following U.S. elections compared to those without elections.
Three months post-election, the S&P 500 has averaged a gain of approximately 6.6% since 2012. Six months after a vote, the average increase rises to 13.8%, and one year later, it averages a robust 24.8%. In contrast, during non-election years, the S&P 500 has averaged a decline of 0.03% after three months, a gain of only 1.8% after six months, and a modest increase of 6.9% after one year, as illustrated in the following chart.
The price performance of bitcoin following U.S. presidential elections mirrors this trend. The months and year after a U.S. presidential election have been exceptionally positive for bitcoin since 2012. This disparity in price movements between election years and non-election years is clearly depicted in the following chart.
Interest Rate Cuts by the U.S. Federal Reserve
Now, let’s highlight another significant aspect of 2024: The U.S. Federal Reserve has lowered interest rates for the first time since 2020, likely initiating a new cycle of rate cuts. In this final section, we will explore how this reduction in interest rates in the U.S. could impact the markets.
As the Federal Reserve embarks on this new cycle of interest rate cuts—aiming to reduce borrowing costs from their highest levels in over two decades—it is valuable to examine historical instances of such cycles.
Historically, when the Fed has implemented rate cuts during a recession, the S&P 500 has averaged a decline of 4% in the first six months following the initial cut. Conversely, during periods without a recession, the S&P 500 has experienced an average increase of 14% in the same timeframe. Recessions are typically identified retroactively by the National Bureau of Economic Research. Currently, there are few indicators suggesting that the U.S. is in a recession, although some signals indicate the possibility of one in the foreseeable future.
By distinguishing between different types of rate cuts—such as normalization, panic, and recessionary cuts—we can gain a more nuanced understanding of their potential impact on the markets.
In two out of three instances, interest rate cuts implemented during the initial months to a year following the first-rate reduction have positively influenced the price performance of the S&P 500, particularly in the contexts of normalization or panic rate cuts.
As previously noted, rate cuts during a recession often signal a negative outlook for the market, as the months following the initial cut have historically been marked by declining price movements. Given the current landscape, it appears that the U.S. Federal Reserve has opted for a normalization rate cut this year, similar to its decisions in 1989, 1995, and 2019. Historical data lends credence to the expectation of a generally positive price trajectory in the months ahead.
What Lies Ahead?
In this article, we have explored several indicators to provide historical context for bitcoin's current situation. The year 2024 is indeed notable: In the spring, the fourth bitcoin halving occurred, U.S. elections are slated for November, and the Federal Reserve made its first interest rate cut since 2020 in September. As we approach October, we enter a historically positive seasonal phase for bitcoin.
What implications might this have for bitcoin's price development? While these historical data points do not guarantee the recurrence of similar trends in the future, it is crucial to approach this information with discernment. Nevertheless, it is intriguing to observe that from various perspectives — be it seasonality, price movements following bitcoin halvings, U.S. presidential elections, or interest rate cuts — historically, a positive phase for bitcoin seems to be on the horizon. And as the proverb goes, history may not repeat itself, but it often rhymes.