

Crypto & Macro - Is the Bottom in? Version 3.0

Denis OevermannInvestment Analyst / Crypto Researcher
3 May 20238 Min
Despite the historically implied certainty that economic turmoil, most likely a recession, is ahead of us, the crypto market progressed and recovered in line with expectations and our models’ predictions. Derived risk metrics and inflection points of long-term momentum indicate that the bottom has been in for the currently transitioning cycle.
Executive Summary
- The likelihood of Bitcoin closing a year positively in the green is 78.5% (11 out of 14 past years), for a median 2.05x annual return, and an average 268% (3.68x) p.a. return since 2017.
- Bitcoin only declined in price once every four years (2014, 2018, 2022) in accordance with its halving cycles, and never declined two years in a row – supporting the current recovery.
- Macroeconomic and monetary conditions are easing on some metrics, whereas the leading indicators for a recession solidified – conditions that offered attractive entry prices, historically.
- Our derived risk metric for Metcalfe’s Law exactly identified the past cycle tops (extreme risk) and long-term entry prices (low risk), indicating that current prices align with long-term, low risk entry price territory.
- Case for Crypto 2.0: Equities such as the S&P 500 (10.7% p.a.) barely outperformed Global Liquidity provisions (and asset purchases) by central banks (8.1% p.a.) over more than one decade – Bitcoin outperformed central banks and equities in just the past 3.5 years alone with 52% p.a. since 11/2019.
- Inflection points of the momentum of long durated two- and four-year price averages for Bitcoin identified all historical cycle tops and bottoms.
- The most recent entry inflection point flashed in March at prices around $22’243 for BTC – Inflection points only occur once per momentum cycle, which last around two to three years.
1. Introduction
Despite continuously tightened macro conditions and financial “turmoil”, Bitcoin managed to almost double in price since its most recent lows, temporarily climbing above $30k, a price not seen for more than 300 days. Given the substantial momentum of the recovery, amidst unfavorable macro conditions, a transitory decoupling seems to have taken place. The most pressing concern is whether the rally can be sustained, or if prices will head lower again – and of course, how our most recent data and models indicate whether the bottom is in.
In this third version of our novel Crypto & Macro format (launched on the 8th of March), which, given the current market cycle is titled “Is the bottom in?” – Version 3.0, we will indicate the likelihood of the rally continuing, and the year closing positively. Also, the monetary macroeconomic environment will be revisited, analyzing tightened conditions, the looming recession and its implications. Getting to the core of whether the bottom has been seen, we will look at the demand side of Bitcoin through Metcalfe’s law, including our novel risk metric. Looking at global liquidity metrics, the Case for Crypto 2.0 is established, indicating the necessity for a crypto allocation in a portfolio. Lastly, we look at the momentum of crypto cycles, and their inflection points, which indicate the best entry and exit prices for respective cycles. – Let us dive in!
2. Will the rally continue
Successfully determining if the price will appreciate or decline, especially in the short term, is hard to do, and subject to intraday events messing up predictions. Investigating how BTC’s price will behave in the long run, deduced by historical data, yields more reliable indications and projections, how the price might progress.
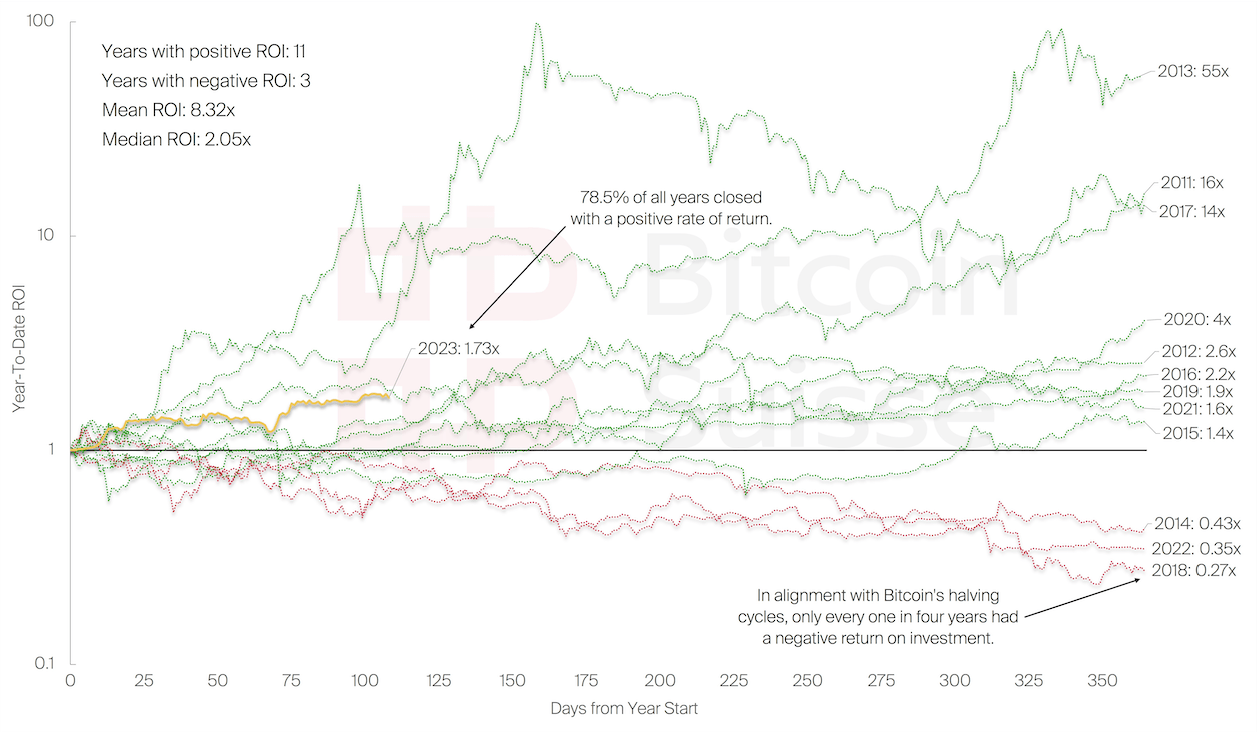
Figure 1 depicts the year-to-date (YTD) return on investment (ROI) for BTC in all its prior years. The major observation we can make is that BTC closed positively in 11 out of 14 years (2009 and 2010 not included in the chart), yielding a likelihood of 78.5% for BTC to increase in price each year. In those positive years, BTC had an average 1000%, or 11x price return (since 2009) – the negative years saw an average decline of 65% in price. Overall, the average return for BTC has been an 8.32x increase in price (since 2011) – whereas the median has been around 100% p.a. (2.05x). Excluding the early, hyper-growth stage of BTC, the average return over the past six years has still been 268% p.a. (3.68x increase in price since 2017).
Overall, past data clearly indicates that it is more likely for BTC to close positive in a given year. We can also recognize that BTC had negative YTD returns every 4th year (2014, 2018, 2022), in alignment with its halving cycles. Historically, BTC never closed negative two years in a row. The overall track record and the fact that last year closed in the red indicate that it is the most likely scenario that BTC will end the year positively.
3. Revisiting Macroeconomics
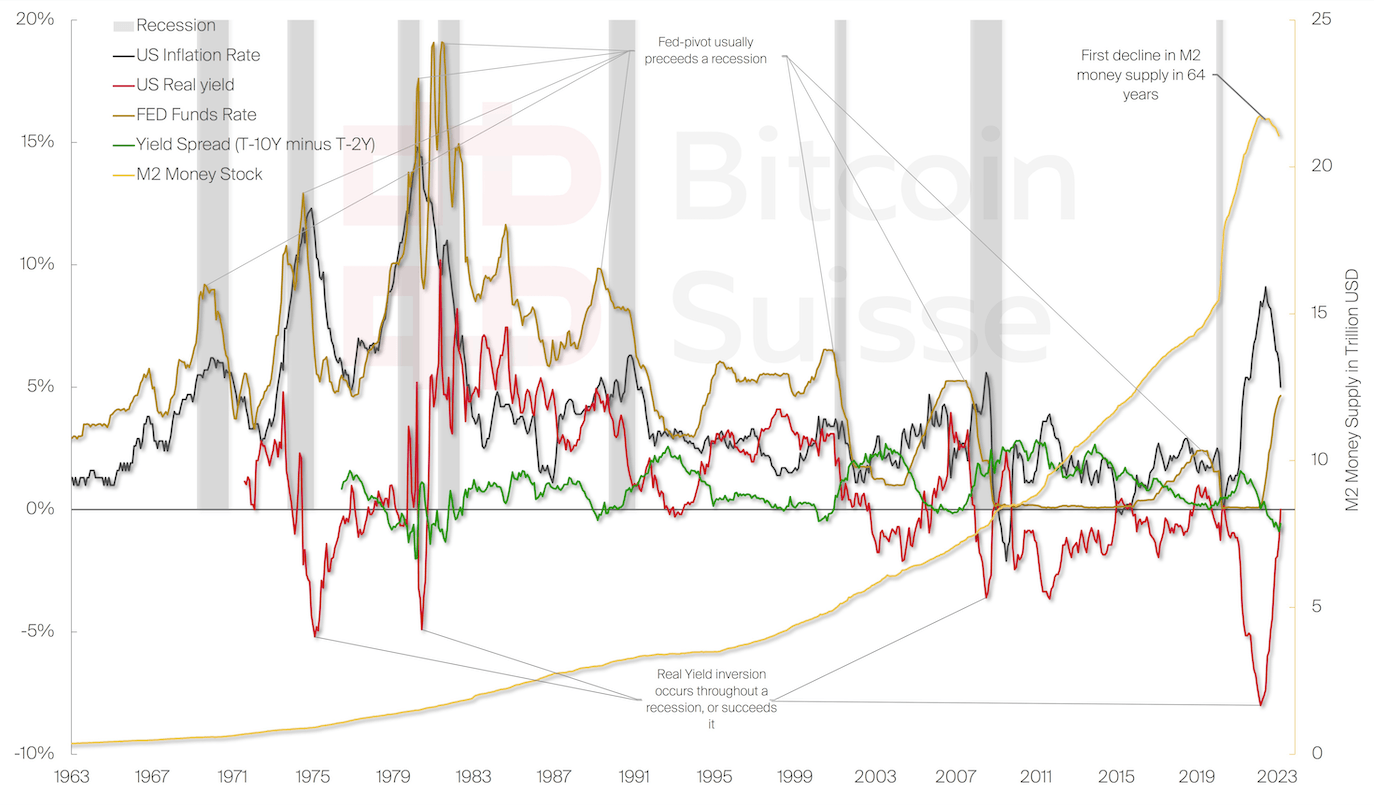
The current recovery in the crypto markets matches what would historically be expected from a pure cycle and price progression standpoint. Nevertheless, it is the first time that the macroeconomic and financial conditions have been severely tightened in the history of the crypto asset class. Therefore, it is crucial to revisit the macroeconomic and monetary environment we find ourselves in to evaluate the risks and potential impacts. Figure 2 has been analyzed in depth in “Is the bottom in? – Version 1.0” which is why we will focus on the most significant changes.
Fortunately, U.S. real yields recovered to 0%, as shown in Figure 2, due to inflation continuing to decline, while the interest rates have been sufficiently hiked. Nevertheless, the real yields recovering sufficiently into healthy territory is dependent on the fragile balance of inflation not heating up again, as happened in the 1970s, and the economy sustaining the tightened financial conditions resulting from the elevated interest rates. Markets at this point price in the rates to be cut by early summer already, which makes this scenario even more volatile.
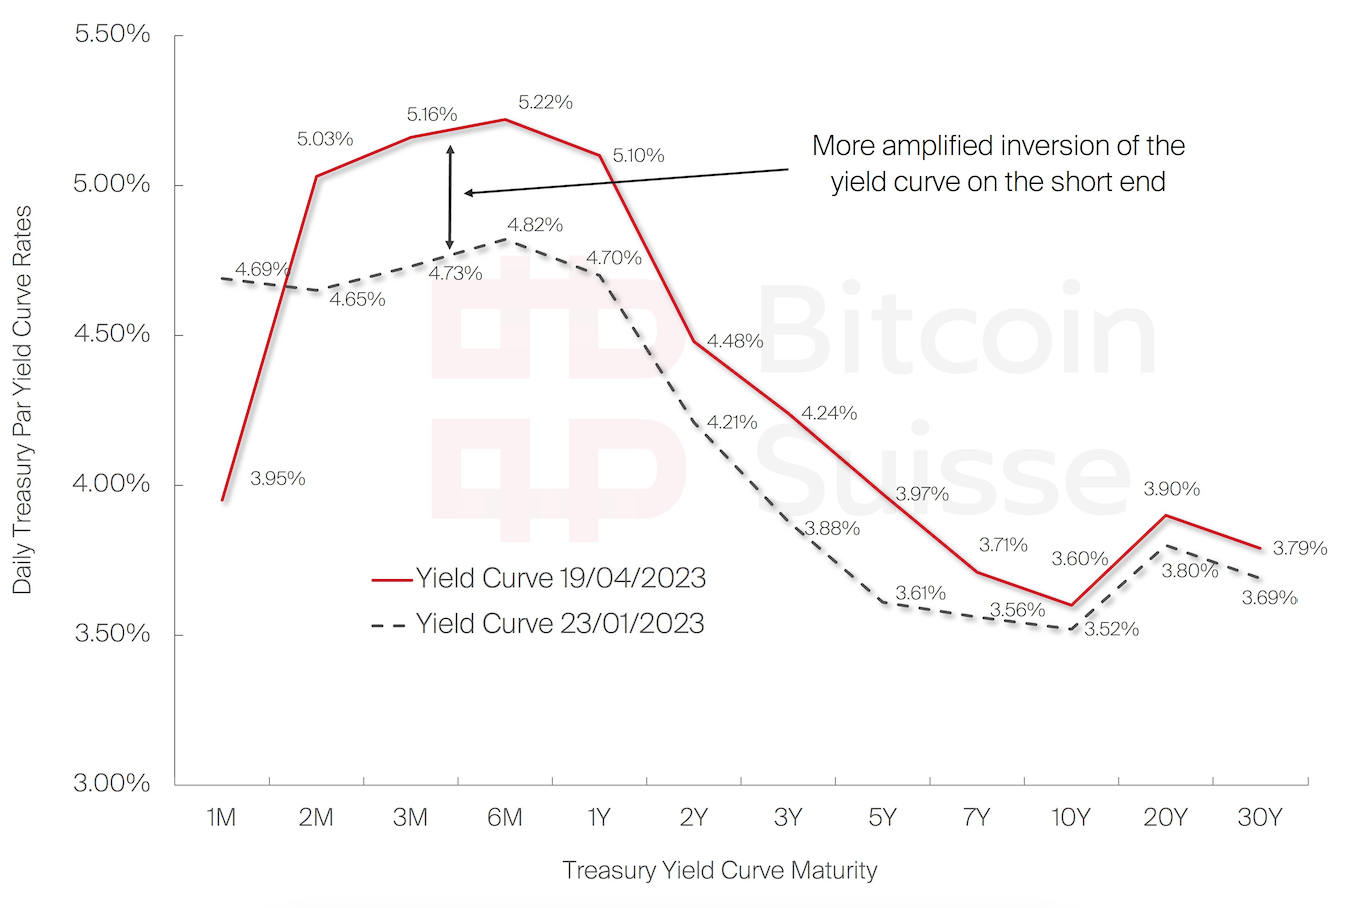
The most critical aspect and remaining risk overall for the economy and subsequently the crypto asset class is the yield spreads continuing to decline further negative. This implies that the difference in yield between long duration and short duration government bonds became even further imbalanced. Figure 3 depicts the change over the course of the past quarter. Inverted yield curves always caused economic downturns. Historically, in around 90% of the cases a recession followed during the “un-inversion” of and inverted yield curve.
However, the best long-term entry prices in the past occurred throughout economic downturns such as the current one, whereas most recessions get declared in hindsight, after a partial recovery has already set in.
4. Metcalfe’s Law
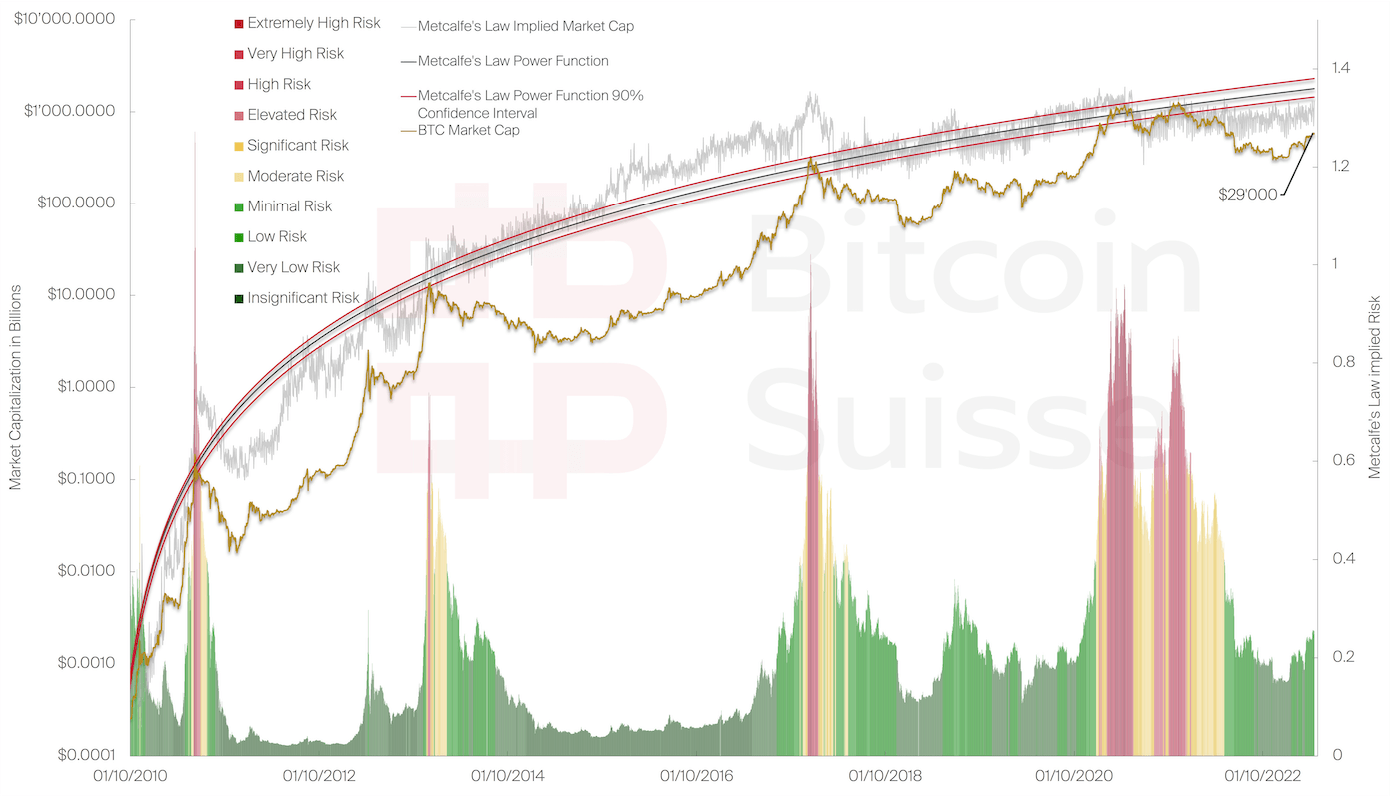
Much of our prior analysis centered around macroeconomics, price dynamics and long-term trends. A notable metric that must be analyzed is the demand side which enables us to determine how network adoption impacts the long-term price growth. This is captured by Metcalfe’s Law (ML) which defines a network’s market capitalization as being equivalent to the squared count of its users and is perfectly applicable to Bitcoin.
As can be seen in Figure 4 the long-term price progression of BTC is following Metcalfe’s Law’s implied market cap. Notably, BTC tends to only coincide with the ML market cap during the final stage of its hype cycles. This enables us to create a risk metric based of Bitcoin’s price and Metcalfe’s Law, which is visualized with the color-coded risk bars below. As can be seen, the risk metric performs exceptionally throughout the entirety of Bitcoin’s price history, identifying the extremely risky and overvalued cycle tops.
Equally, cycle periods with relatively low risk are determined and can be observed in between, which indicate that from the demand side, the current BTC prices reside in a very low risk territory. If the current growth rate of network adoption and price appreciation stay relatively constant, prices can increase while simultaneously the risk remains low.
5. The Case for Crypto 2.0
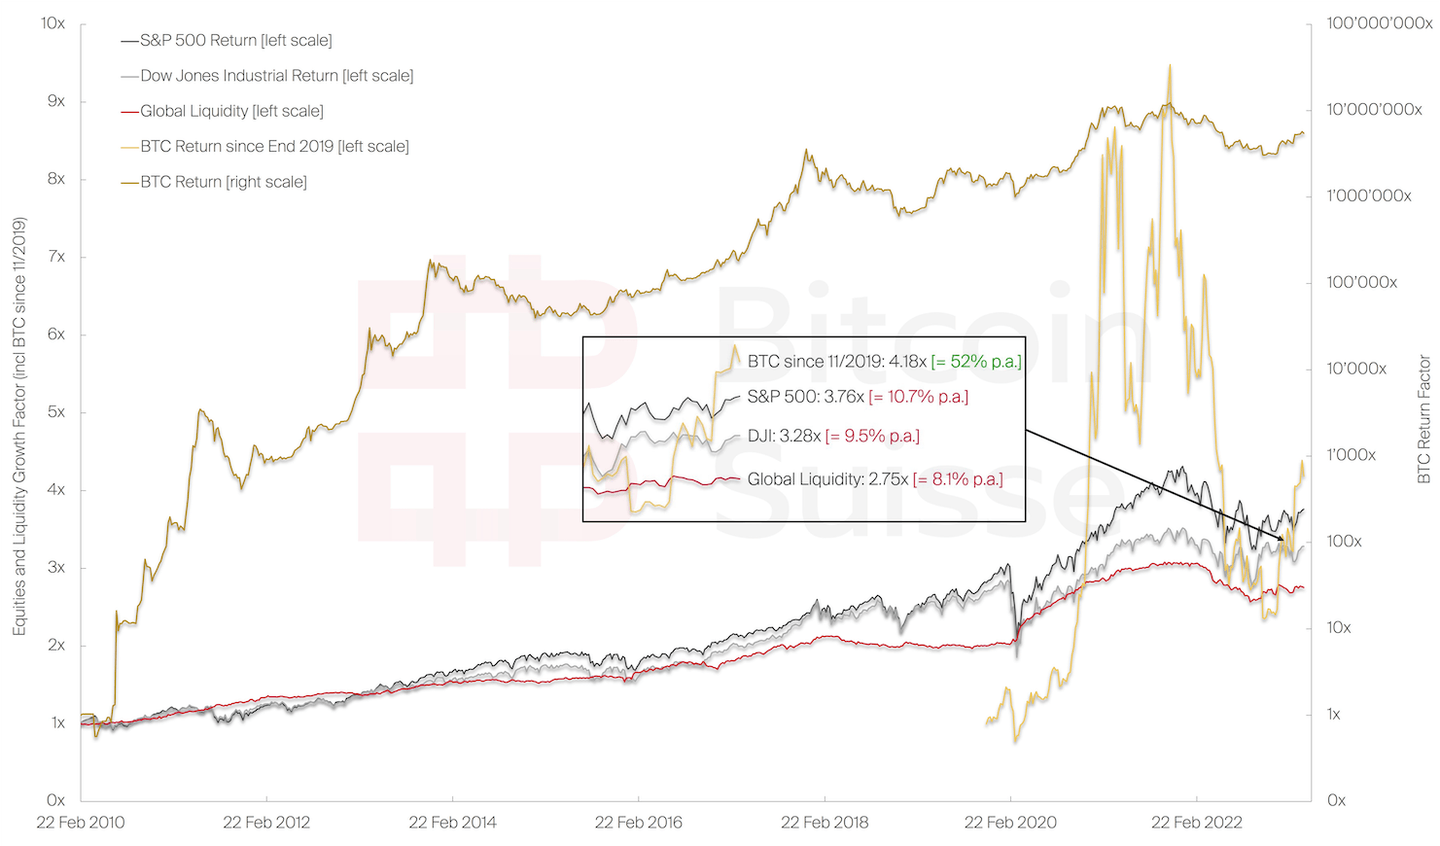
It is undeniable that BTC and the crypto asset class saw a tremendous price growth since their inception. However, a major relevant data point to consider is what is driving asset classes’ returns generally, and how crypto fits into the big picture. Figure 5 depicts the asset returns of the S&P 500, the Dow Jones Industrial Average (DJI) and Bitcoin and sets it in relation to the global liquidity and its growth. Global liquidity refers to liquidity provisions by the entirety of significant central banks (CB) globally, which is equivalent to their asset purchase programs and thus assets held on central banks’ balance sheets.
As can be seen the return over more than a decade averages out to a 3.76x (10.7% p.a.) and 3.28x (9.5% p.a.) return for the S&P and DJI, respectively. These equity returns might appear decent, yet global liquidity and assets purchased and held by central banks throughout the same time period grew by a factor of 2.75x (8.1% p.a.). This implies that the major equity indices barely managed to outpace central banks’ balance sheet growth by more than 2% per annum.
Contrary, even a late investment into BTC at the end of 2019 returned a 4.18x (52% p.a.) until today, outperforming the major indices’ returns over more than a decade in less than 4 years. Time to outpace global liquidity and central banks?
6. Inflection Points
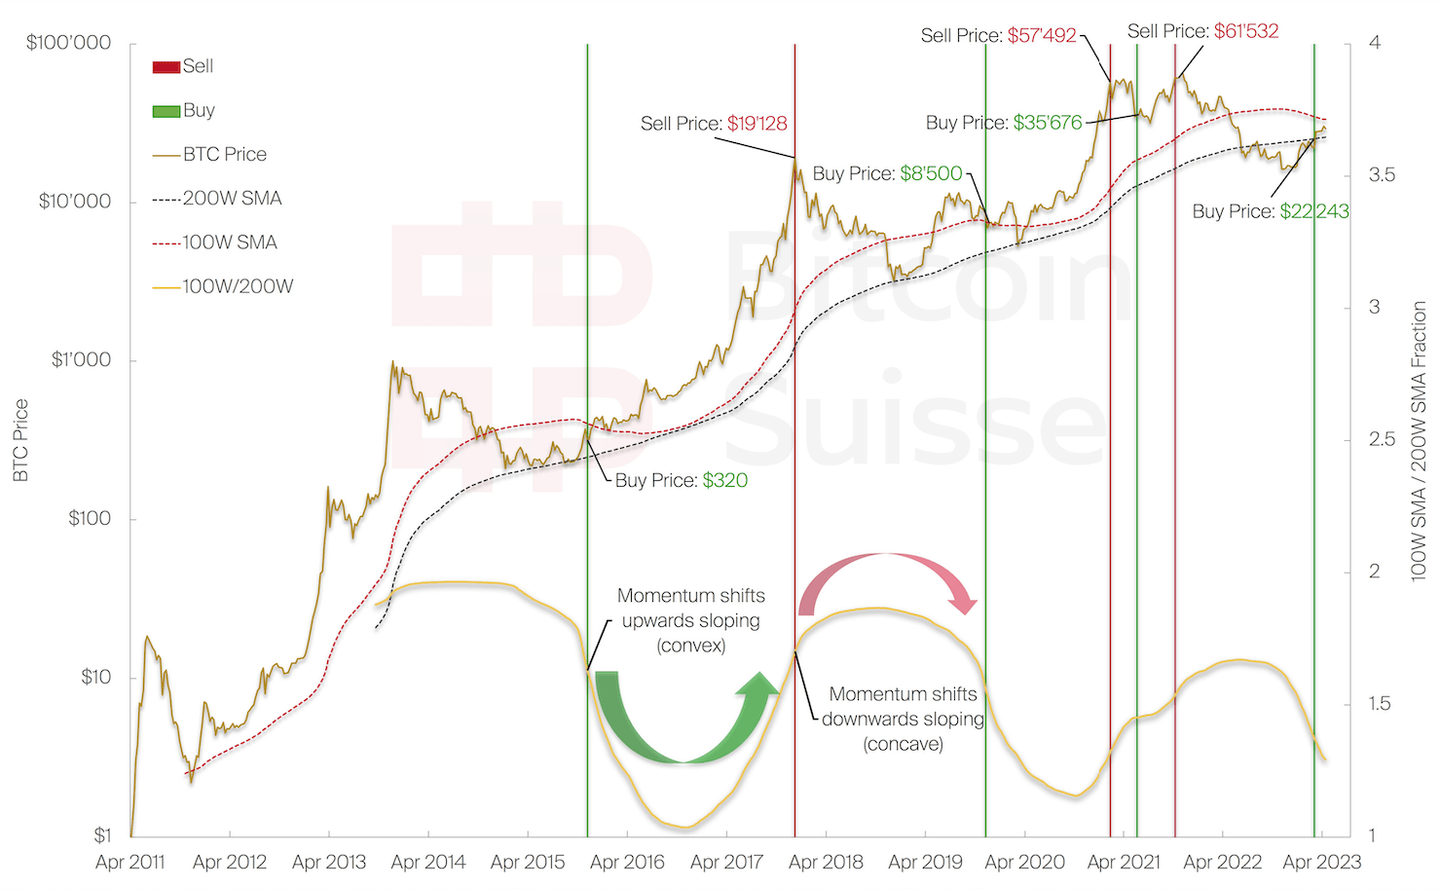
Navigating the cycles of the crypto asset class and Bitcoin becomes inherently easier given the fact that the age old saying “history doesn’t repeat, but it often rhymes” (Mark Twain) holds especially true for crypto assets. Applying very long durated simple moving averages (SMA) on a 100- and 200-week basis (thus two- and four-year average prices) yields reliable long-term indicators. It is however the derived fractal between the two year and four-year average prices that helped identify the best exit prices and bottom prices, historically.
We can observe how the fractal of the 100W SMA / 200W SMA depicted below, in Figure 5, oscillates with perfect cyclicality. It is however not the tops and bottoms that offered the best entry and exit prices historically. Instead, it were the exact inflection points, which is the point where the oscillator shifts from a concave function part to a convex one, implying that the curve goes from a more and more rapidly descending downwards slope to a faster increasing upwards slope. This can be easily thought of as a shift in the momentum of the deviation between the two- and four-year average prices.
Historically, once the downwards momentum slowed down and transitioned into an upwards momentum is depicted by green entry bars. Contrary, the shift from upwards momentum to increasing downwards momentum is shown by red exit bars. We can observe that the inflection points identified the respective bottom and top prices with remarkable precision, even including a double entry and exit throughout the past cycle’s double top.
The most recent long-term entry signal, as indicated by a shift from slowing downward momentum to increasing upwards momentum has occurred in March at a BTC price of roughly $22’243. Historically, inflection points only signal one entry and exit point per long-term momentum cycle, which lasts around two to three years.
7. Final Assessment
It is with almost intimidating perseverance that the crypto asset class recovered year-to-date, undisturbed by the stringent macroeconomic and tight financial conditions. Due to its cyclicality the crypto market can be tracked optimally with long-duration models and thus we can determine top and bottom price territories almost exactly.
Despite the historically implied certainty that economic turmoil, most likely a recession, is ahead of us, the crypto market progressed and recovered in line with expectations and our models’ predictions. Derived risk metrics and inflection points of long-term momentum indicate that the bottom has been in for the currently transitioning cycle. Potential price declines within the present price range are a possibility and in alignment with our models.
As the Case for Crypto 2.0 points out, the long-term appreciation of traditional equity indices barely outpaces the growth and provision of liquidity from central banks globally. Contrary, Bitcoin and crypto assets appear to be among the few assets that managed to show significant returns beyond central banks’ asset purchase induced equity returns.
8. Table of Figures and Data Sources
Figure 1: (Chart) Bitcoin Suisse (Data) BTC Index – TradingView
Figure 2: (Chart) Bitcoin Suisse (Data) Bureau of Labour Statistics, Federal Reserve, Federal Reserve Bank of St. Louis, World Bank
Figure 3: (Chart) Bitcoin Suisse (Data) U.S. Department of the Treasury
Figure 4: (Chart) Bitcoin Suisse (Data) BTC Index, CoinMetrics – TradingView
Figure 5: (Chart) Bitcoin Suisse (Data) BTC Index, SP Global, DJI, BOR, RBI, SNB, BOE, PBOC, BOJ, ECB, FED, FRB NY – TradingView
Figure 6: (Chart) Bitcoin Suisse (Data) BTC Index – TradingView
9. Disclaimer
The information provided in this document pertaining to Bitcoin Suisse AG and its Group Companies (together “Bitcoin Suisse”) is for general informational purposes only. The information represents the opinion of Bitcoin Suisse at the date of issue. It should not be considered exhaustive and does not imply any elements of a precontractual or contractual relationship nor any offering or advice of any kind. Bitcoin Suisse does not provide tax, legal, or investment advice, and the information contained in this document do not take into account the specific investment objectives or financial situation of any individual person. While the information is believed to be accurate and reliable, Bitcoin Suisse and its agents, advisors, directors, officers, employees, and shareholders make no representation or warranties, expressed or implied, as to the accuracy or completeness of the information contained in this document. Bitcoin Suisse reserves the right to amend or replace the information contained herein, in part or entirely, at any time without notice and undertakes no obligation to provide the recipient with access to the amended information or to notify the recipient hereof. Investing in crypto assets or any other investment may entail certain risks, including market, liquidity, credit, technical and operational, as well as legal and regulatory risks and may be subject to other relevant factors. Bitcoin Suisse does not guarantee the performance of any investment, and past performance is not a guarantee of future prices. Investment decisions should be made solely based on a thorough evaluation of the specific investment objectives and financial situation of the individual person concerned. Therefore, Bitcoin Suisse expressly disclaims any and all liability that may arise from decisions based on this document. The information provided is not intended for use by or distribution to any individual or legal entity in any jurisdiction or country where such distribution, publication, or use would be contrary to the law or regulatory provisions or in which Bitcoin Suisse does not hold the necessary registration, approval, authorization, or license, in particular in the United States of America including its territories and possessions. In particular, Bitcoin Suisse is not registered with the U.S. Securities and Exchange Commission as a broker-dealer under the U.S. Securities Exchange Act of 1934, as an investment adviser under the U.S. Investment Advisers Act of 1940, or with any other competent authority under any applicable federal or state laws in the United States of America. Therefore, Bitcoin Suisse does not offer any services to “U.S. Persons”, as defined under applicable U.S. laws. This material is not intended for U.S. Persons and does not constitute a solicitation of any offer to U.S. Persons. Except as otherwise provided by Bitcoin Suisse, it is not allowed to modify, copy, distribute, transmit, display, reproduce, publish, license, or otherwise use any content for resale, distribution, marketing of products or services, or other commercial uses. Bitcoin Suisse 2023.
Related Articles
 Tech Insights
Midnight: Verifiable Yet Private, the Fourth Generation of Blockchain
For more than a decade, blockchain developers and enthusiasts have promoted state integrity as their core unique selling proposition, emphasizing that transactions on public blockchains are accessible and visible to everyone.
12 Mar 20265 Min Tech Insights
Bitcoin ETF Decision: Examining the Landscape Leading to the Potential Green Light
In the dynamic world of cryptocurrency, the spotlight is currently fixated on a historic event—the potential approval of a U.S. Spot Bitcoin ETF. As we approach the final deadline for ARK on January 10th, Bitcoin Suisse delves into the unprecedented developments that have set the stage for what could be a transformative moment in the industry.
9 Jan 20247 Min Tech Insights
Exploring Supply Transparency
A joint research report by Coinmetrics and Bitcoin Suisse Research.
17 Oct 202312 Min
Personal Support, Every Step
Our team of native experts are here to provide you with the tools, insights and support you need.
Opening hours
24/7 online
Monday to Friday: 7am to 7pm
Call us toll-free from Switzerland
Call us from abroad
