No Surprises From The Fed, Macro Drives The Market & Sentiment Remains Low
Mar 21, 2025 - 7 min read
Listen to the Weekly Wrap on Spotify and Apple Podcasts. It is a summary with the help of AI-voices.
This Week’s Top Stories
“Jerome Powell: Sentiment has fallen sharply, economic activity has not – and the Fed is not going to be in a hurry to move on cuts” – Wednesday, 19 March 2025
- On Wednesday, the Federal Reserve announced its interest rate decision, maintaining their target range for the federal funds rate at 4.25 to 4.50 percent. The quarterly released dot plot, a chart that records each Federal Reserve official’s projection for the federal funds rate until the end of the year, indicated that the Fed officials do not see any change in their path forward compared to the last dot plot from December 2024. The Fed also announced that the committee will slow the pace of declining its securities holdings by reducing the monthly redemption cap on Treasury securities from $25 billion to $5 billion.
- The dot plot provides interesting insights: The Fed maintains its rate projections despite increasing inflation projections and lowering GDP growth.
- Powell mentioned during the press conference that Trump’s tariffs played a role in the Fed’s higher forecast for inflation temporarily, but also noted that there is no story of an increase in long-term inflation expectations.
- Another interesting comment was that the relationship between survey data and actual economic data hasn’t been very tight, and that while sentiment in the markets has fallen sharply, economic activity has not.
- Additionally, Powell stated that while forecasters have raised their possibility of a recession somewhat, the likelihood remains low.
A Quick Crypto Overview: “We Are All Macro Traders Now”
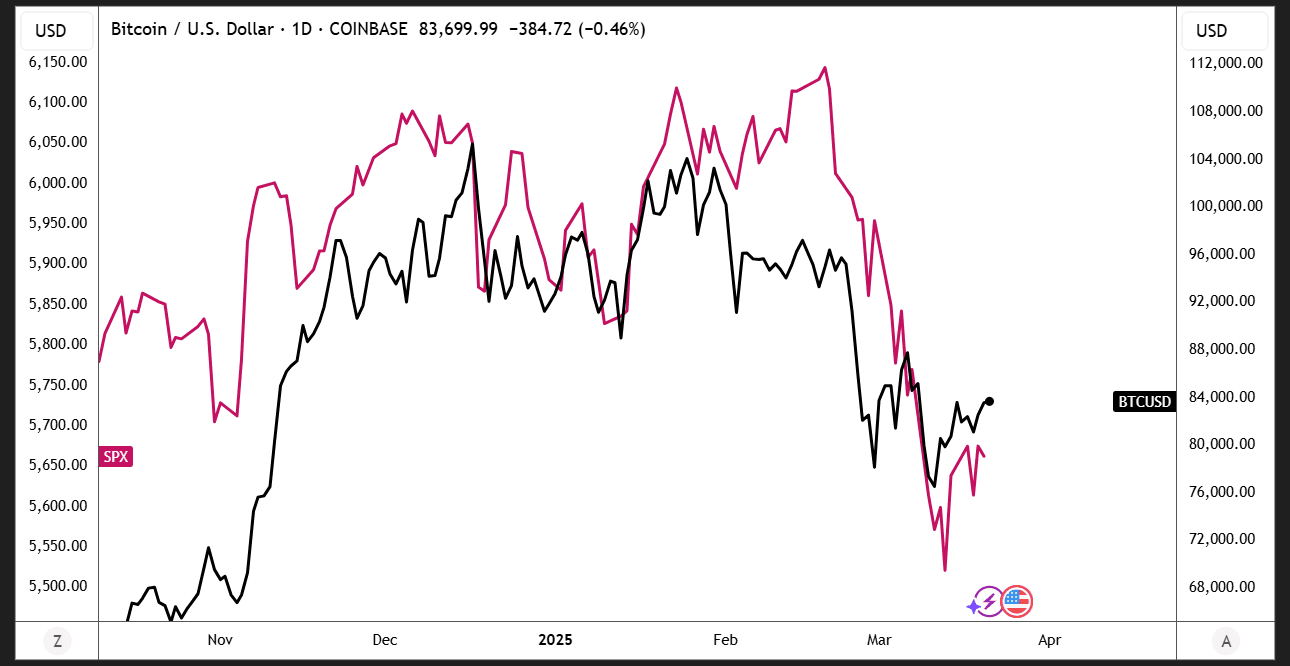
Bitcoin and the crypto market have been lacking a clear narrative for the past few weeks and are closely following macro developments surrounding Donald Trump and the U.S. economy. The chart below shows the price action of Bitcoin and the S&P 500, highlighting the resemblance between the two. The correlation between Bitcoin and U.S. stock indices has been increasing since the start of the year and remains higher than before, as we also indicated in our latest Industry Rollup publication.
The stablecoin dominance, indicated in the chart below by the stablecoins USDT, USDC, and DAI, has continued to trend upward since December of last year. As we can see in the chart, stablecoin dominance reversed its trend at the beginning of December 2024 and has been moving upward ever since. However, when looking at the last couple of days, the chart below begins to show signs of exhaustion in this uptrend. This might be something worth keeping an eye on.
Chart of the Week: Bitcoin is Experiencing a Fundamental Transformation in its Ownership Structure
This week, we want to highlight our on-chain chart of the month from our latest Industry Rollup report. In the report, we closely examined corporate, institutional, and sovereign accumulation of BTC over the past year and discovered that, as of the end of February, roughly 14 percent of Bitcoin’s supply resides in ETFs, corporate balance sheets, and government wallets. Over the past year, more than half a million BTC have found their way into U.S. spot ETFs. Public companies are also on a buying spree, led by Michael Saylor and Strategy, collectively adding more than 1’000 BTC per day since January 2024, indicating an 80 percent increase in BTC holdings across 2024.
But what could this mean exactly? As both institutional and sovereign buyers tend to hold their BTC for the longer term, this further tightens the supply of BTC, which could amplify the potential for large price moves as soon as demand surges again.
What’s Happening On-Chain? BNB Chain’s DEX Volume is on a Tear, The Hyperliquid Whale & a Pudgy Penguins ETF
The BNB Chain has taken the number one spot in DEX volume by chain, as its weekly DEX volume jumped by over 66 percent, while most competitors, such as Ethereum and Solana, have lost around 30 to 50 percent week-over-week. The surge in activity and volume on the Binance Smart Chain is likely attributed to recent memecoin launches, such as Mubarak and Tut, both of which have some connection to Binance co-founder CZ, who has been relentlessly pushing for memes on the BNB Chain over the past few weeks.
Over the past few weeks, many crypto traders have been watching an ominous trader on Hyperliquid who has been opening and closing highly leveraged, large positions – often just before important news was published – leaving many wondering whether this was or is some kind of insider trading. ZachXBT recently reported that the high-leverage trader may have been involved in illegal activities in the past. The wallet cluster surrounding the now-famous 0xf3f whale was flagged as a receiving address on phishing sites, with more than $170'000 in funds flowing in.
In other news, the Solana DEX and automated market maker Raydium will launch its own token launch platform, “LaunchLab,” as a competitor to Pump.Fun. Around the same time, Pump.Fun launched PumpSwap, a token swap service using its own liquidity pools – essentially replacing Raydium as the launch venue for tokens, as all tokens that complete their bonding curve will migrate directly to PumpSwap instead of Raydium.
Yesterday, Igloo announced that Canary Capital has filed for a first-of-its-kind ETF that includes the Pengu token and Pudgy Penguins NFTs.
Digital Asset Fund Flows: $6.4 Billion in Outflows Over Past Five Weeks
Last week, digital asset investment products saw net outflows for the fifth straight week, totaling $1.7 billion. Interestingly, the market is sitting on a record streak of 17 consecutive days of net outflows, the longest period of outflows since 2015. Despite this negative sentiment and rather large outflows over the past few weeks, year-to-date inflows remain positive at almost $1 billion in total.
Something to note: while the U.S. led the regions with the largest net outflows last week, at roughly $1.1 billion, Switzerland ranked second with a staggering $500 million in net outflows last week alone, leaving all other countries far behind.
This week, Bitcoin spot ETFs are on their way to ending a period of net weekly outflows, as Bitcoin products have so far seen four days of net inflows, with Monday and Tuesday bringing in more than $500 million combined. Meanwhile, Ethereum spot ETFs are still experiencing small daily net outflows this week.
Market Sentiment: U.S. Stock Market Sentiment Remains at Historic Bearishness
The U.S. stock market sentiment remains at historic bearishness, as the AAII sentiment survey indicates. The number of members being bearish on the stock market for the coming six months remains around the 60 percent level, while only around 20 percent feel bullish at the moment. This bearish sentiment has of course also spread to the crypto market, as we have outlined in the previous Weekly Wraps a couple of times. The CoinMarketCap fear and greed index dropped into extreme fear territory (15) for the first time since its inception last week and is currently still in fear territory (27).
We want to repeat something from Jerome Powell’s press conference on Wednesday in this regard. It’s interesting that Powell noted how market sentiment has fallen sharply, while in his opinion, economic activity has not. Trump’s remarks on tariffs, the wars in Ukraine and in the Middle East, increasing inflation expectations, and growing recession fears have really taken hold of many investors – is it worth listening to Mr. Powell here and ignoring this bad market sentiment altogether?
Other Relevant News
- Goldman Sachs has acknowledged the increasing significance of cryptocurrencies within financial markets for the first time in its 2024 annual shareholder letter. – Link
- Robinhood has launched Prediction Markets Hub, offering prediction market contracts through CFTC-regulated exchange KalshiEX LLC across the U.S. – Link
- EOS Network is rebranding to Vaulta and plans to conduct a token swap at the end of May 2025 (pending confirmation) to advance its Web3 banking initiative. – Link
- Cosmos gets native EVM framework as it open-sources Evmos. – Link
Looking Ahead: What Will Macro Do?
As mentioned already, we are currently identifying as macro traders, as the crypto markets are lacking a clear narrative and correlations to U.S. equities are on the rise. With the U.S. interest rate decision out of the way and no surprising negative changes in the Fed’s outlook on interest rate cuts for the year, some uncertainty has been removed. It remains to be seen how the whole saga around the Trump tariffs will play out over the coming week going into April – any positive development in this regard could turn market sentiment around and provide some upside potential for U.S. stocks and risk assets in general.
Below, you can find some of the key data releases and events to watch out for next week.
Wednesday, 27 March 2025
- U.K. – Inflation data
- U.S. – Atlanta Fed GDPNow Q1
Thursday, 28 March 2025
- U.S. – GDP, Core PCE Prices, PCE Prices, Initial Jobless Claims
- Japan – Tokyo CPI and Core CPI
Friday, 29 March 2025
- U.K. – GDP
- U.S. – Core PCE Price Index, PCE Price Index, Michigan Inflation Expectations, Michigan Consumer Sentiment
Luca Gnos