Bitcoin Halving Price Developments
Mar 13, 2024 - 5 min read
1 year before the halving
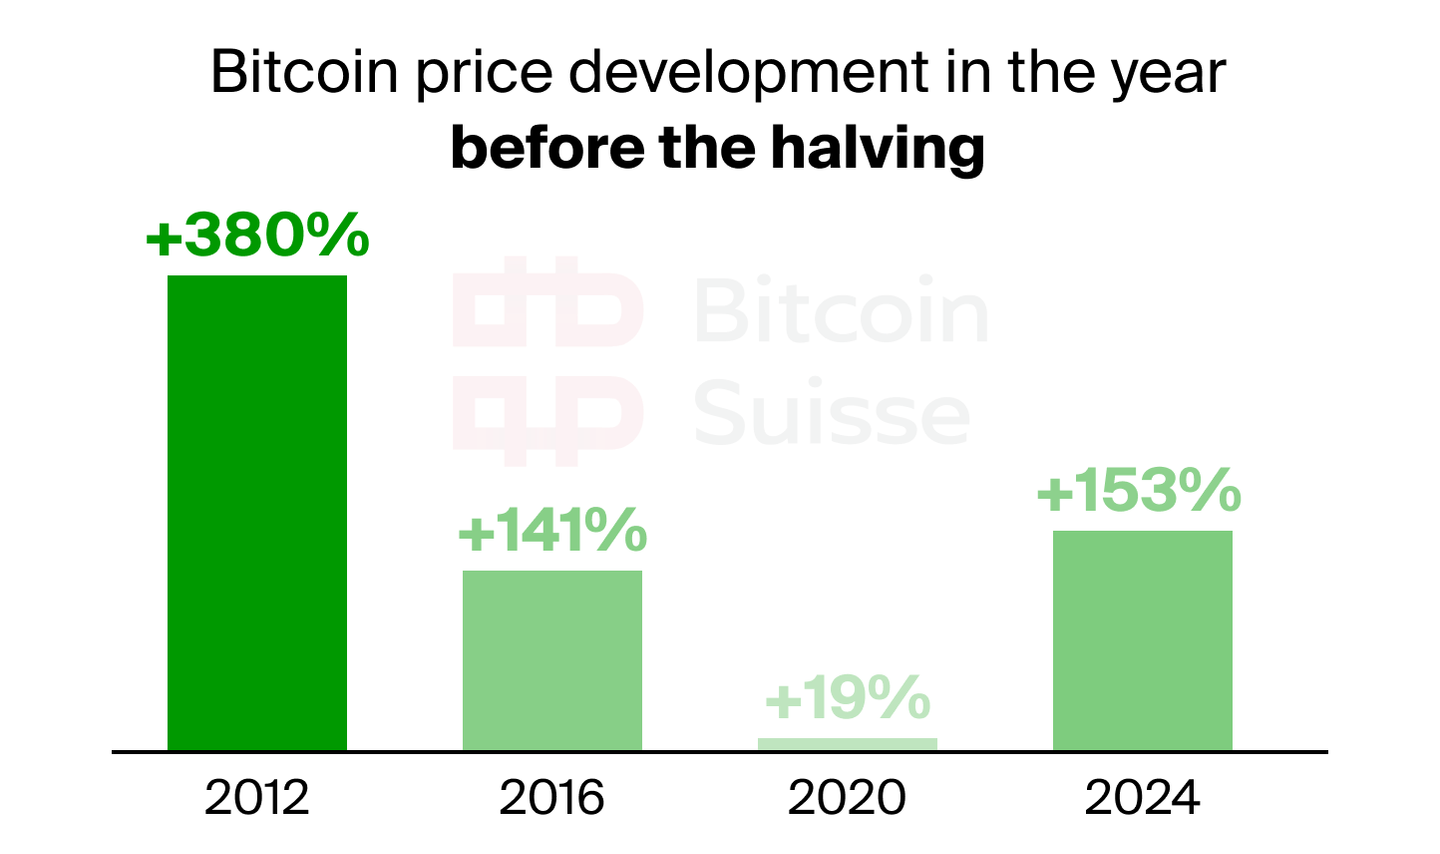
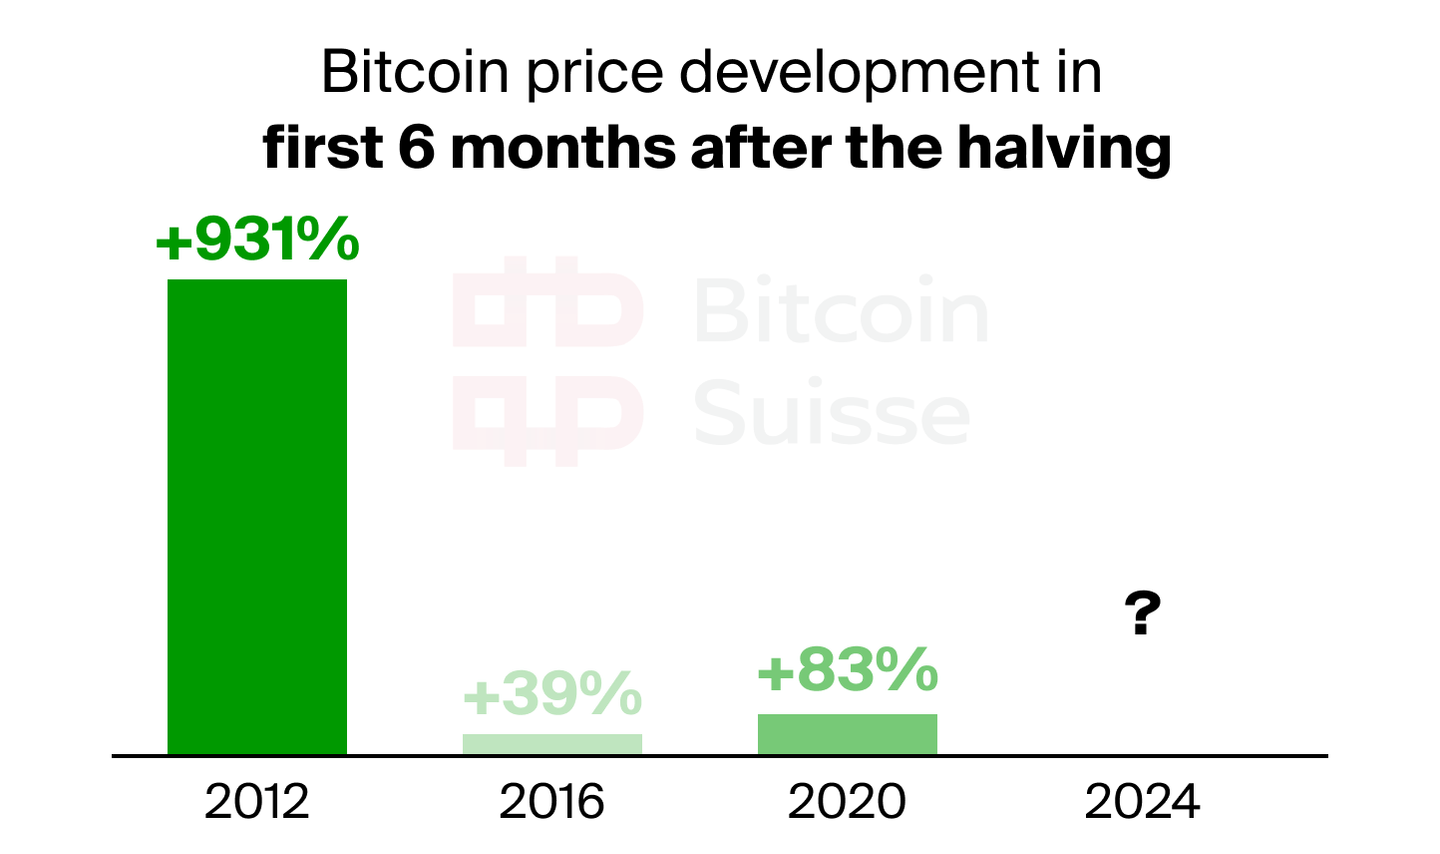
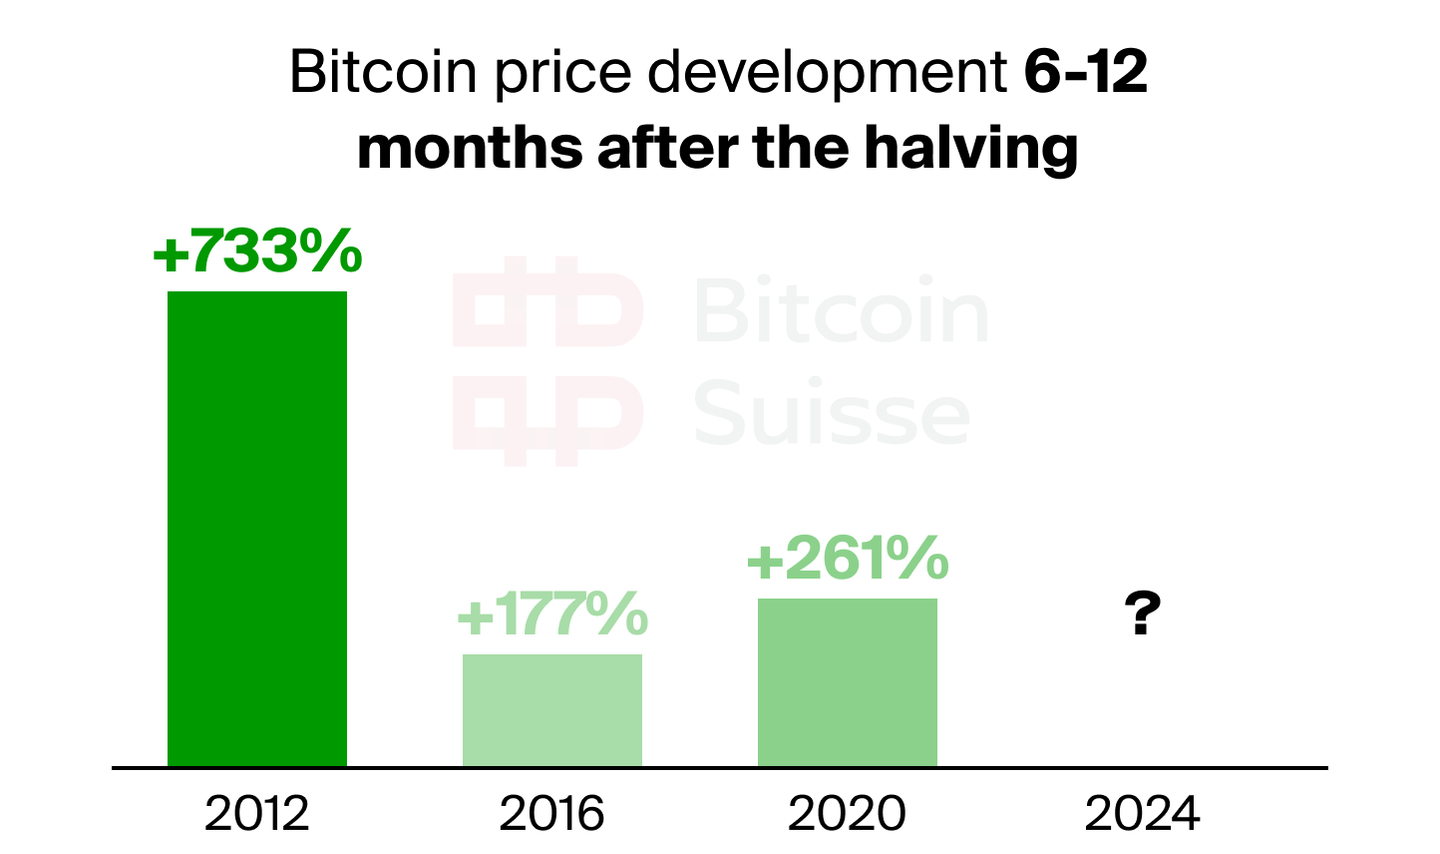
Conducting an analysis of Bitcoin's price development in relation to its halvings reveals how the halving as a narrative could have an impact on the price of Bitcoin. Beginning with the first halving in 2012, Bitcoin's value experienced a significant increase before and after it took place. Subsequent halving cycles in 2016 and 2020 demonstrated a continued price appreciation. The analysis shows that Bitcoin’s price did not only increase after the halvings, but also in the year prior to it.
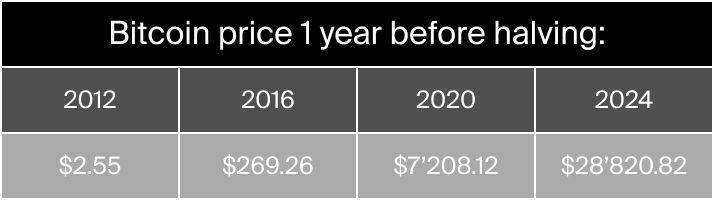
In November 2011, one year before the first Bitcoin halving, Bitcoin's value stood at $2.55, on a daily closing price basis. Whereas in June 2015, one year before the second halving, the price had surged significantly to $269.26. The pre-halving landscape in 2019 witnessed yet another substantial price increase, with Bitcoin trading at $7'208.12 on May 11, 2019, one year before the third Bitcoin halving. Looking ahead to the much anticipated fourth Bitcoin halving in April 2024, Bitcoin's value stood at $28'820.82 one year prior, in April 2023. Another interesting observation when looking at the halvings in 2016, 2020 and 2024 is that Bitcoin’s price has always been substantially higher one year before a halving than one year before the previous halving.
Examining Bitcoin's price dynamics in the twelve months leading up to its halvings shows that this period was accompanied by increases in Bitcoin’s price in all the previous halvings. While Bitcoin increased 380% in the year before the 2012 halving, it increased 141% in the twelve months leading up to the 2016 halving and 19% in 2020. Today Bitcoin is trading at $73’016 which is an increase of 153% since the one-year-before-halving-pivot, it remains to be seen how Bitcoin performs in the coming year after the halving.
6 months after the halving
Analyzing the price performance in the initial six months following each halving reveals a continued and consistent trend of increased prices for Bitcoin. After the 2012 halving, Bitcoin demonstrated a remarkable surge of over 900%. The second halving in 2016 saw a still impressive 39% increase, while the third halving in 2020 resulted in an 83% uptick. Here we cannot see a trend in a direction regarding the percentage move to the upside, but we can observe that in 2016 and 2020 Bitcoin experienced a much smaller increase in price in the first six months after the halving than in 2012.
6 to 12 months after the halving
Beyond the initial six months following the halvings, Bitcoin's price historically experienced further growth. The table below shows that from six to twelve months after the halvings Bitcoin has continued to surge for over 700% in 2012 and six months after the 2016 halving it increased for an additional 177% in the following six months and yet again after the 2020 halving with a remarkable 261% surge in the six-to-twelve-month post-halving-period.
All above mentioned figures underscore the historical pattern of Bitcoin experiencing price increases in the 24 months surrounding the Bitcoin halvings. However, it is important to mention that past performance is no guarantee for future results and external factors and market sentiment likely also play pivotal roles in shaping Bitcoin's market trajectory.
As the next halving is anticipated on April 19, 2024, the forthcoming twelve months will be particularly interesting to observe how Bitcoin behaves and whether it will follow its performance of the first three post-halving years where Bitcoin increased in total 8480% in the twelve months after its first halving, 285% in its first year after the second halving and 560% in total during the first year after the third halving.