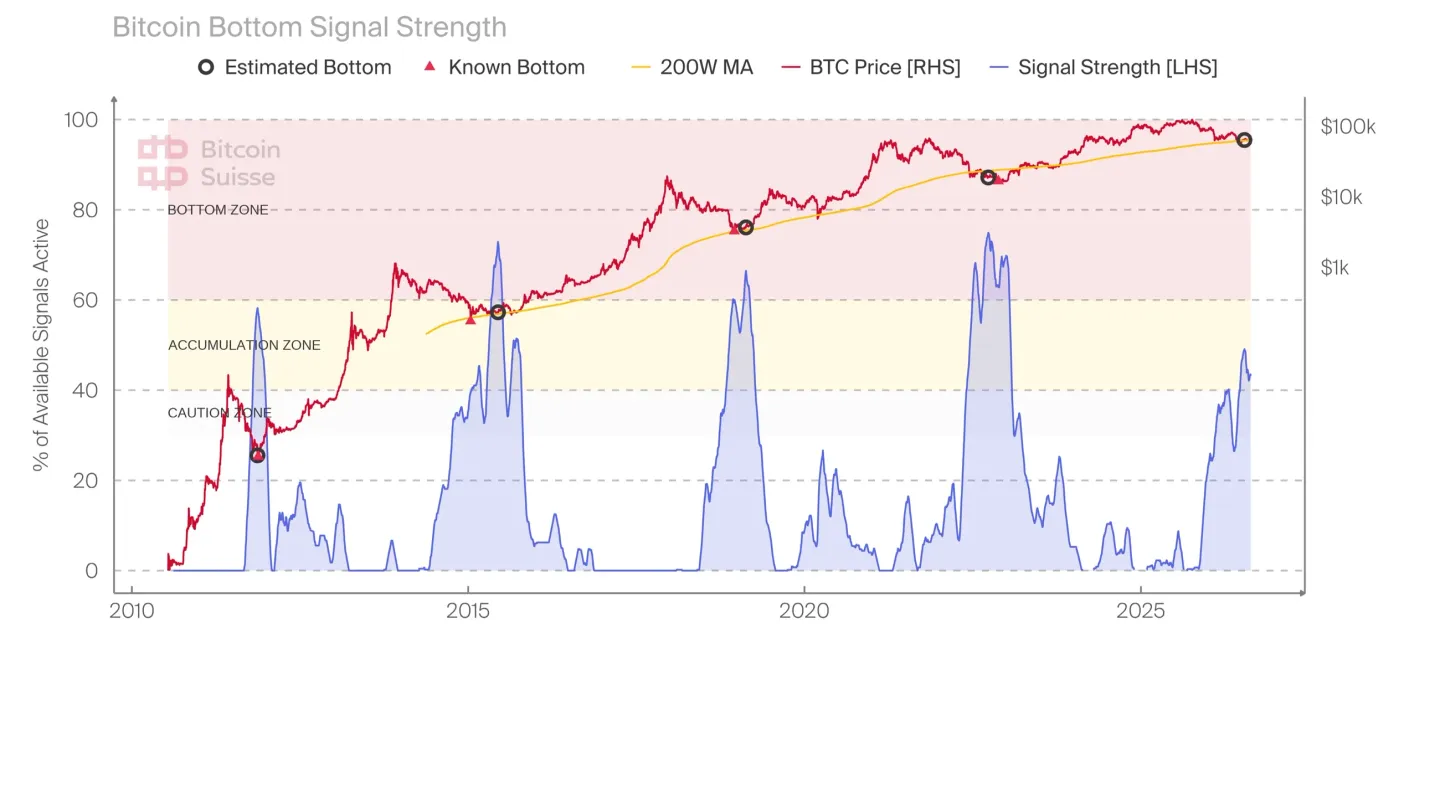
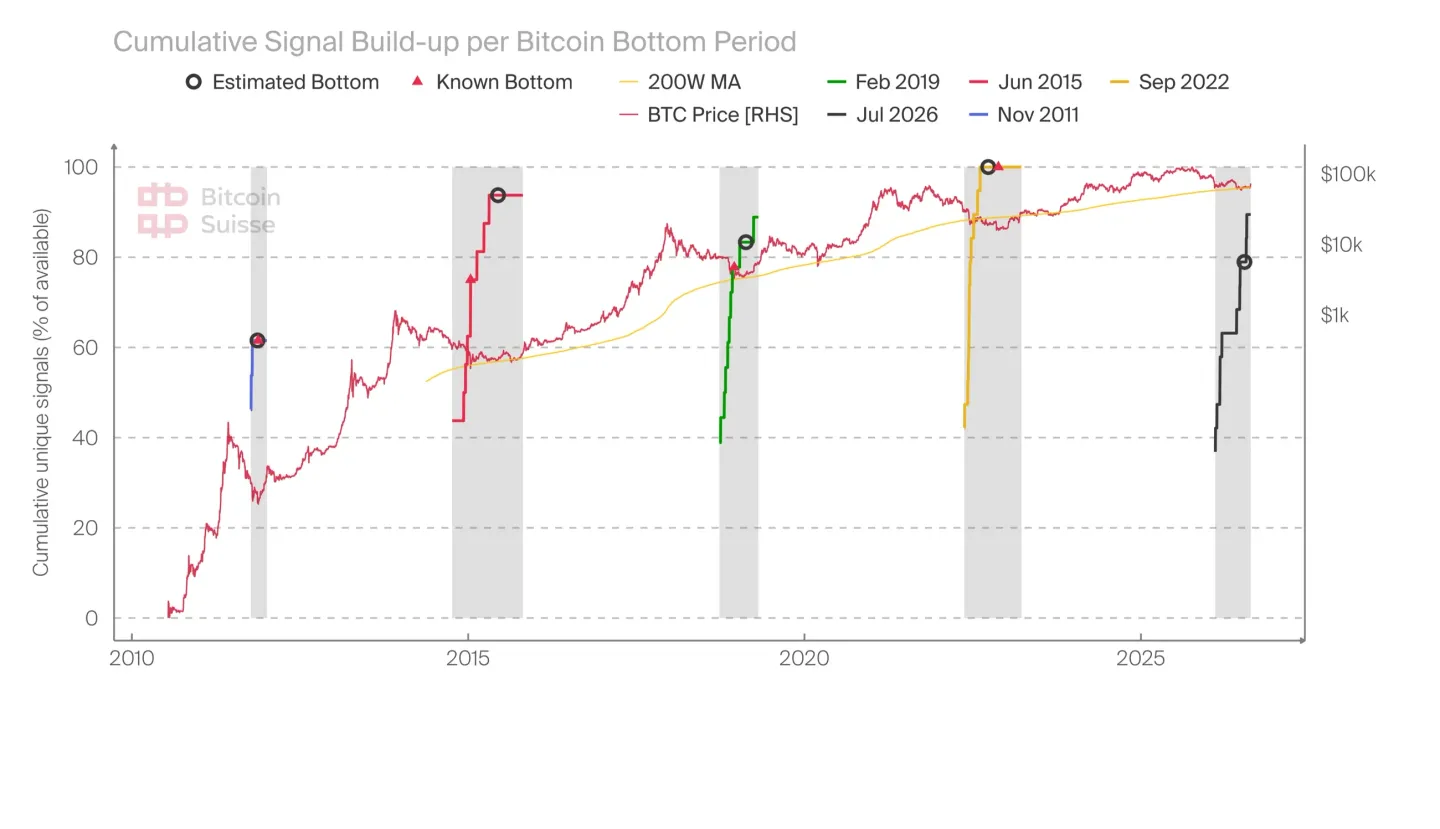
The current Bitcoin cycle has the lowest peak signal strength, the fewest maximum daily indicators, and at 3.80 years, the longest gap between bottoms. The cumulative coverage, however, is broadly in line with historical norms. For context on how Bitcoin cycle lengths have evolved alongside the halving schedule, see our analysis of the halving market cycle.
There is no statistical significance with this data. We have four previous cycles to compare against, so it is very hard to assess what is going on with any certainty. We could say this bottom period has been short. But we could also say this might be the first time it looks like this across the past three bear markets. The 2018 cycle was similarly short at 213 days, so even the length is not definitive.
Reading the Split Signal
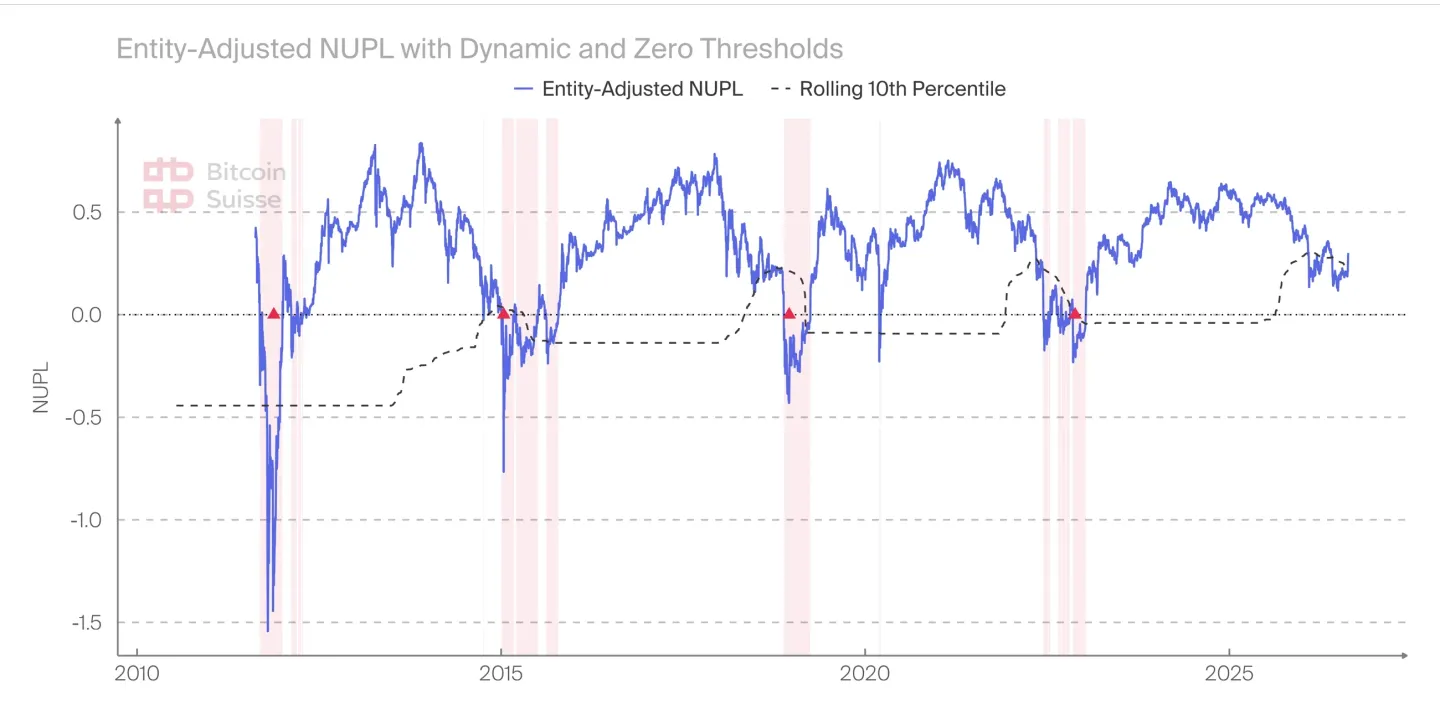
This Bitcoin bear market has behaved differently from its predecessors by these measures. The daily signals have been shallow. The bottom period has not produced the kind of concentrated distress days we saw in previous cycles. And the one indicator that flagged every prior bitcoin bottom has not triggered.
At the same time, 90% of the indicators we track have fired at some point, and the macro catalysts behind the recent rally, Treasury liquidity support, institutional ETF flows, and improving regulatory clarity, suggest something more structural than a typical sentiment-driven bounce.
Maybe this cycle has a different composition because the market itself has changed: a longer preceding bull run, stickier institutional capital, and macro policy doing more of the work than on-chain dynamics. Or maybe Bitcoin NUPL is telling us something the other indicators are not built to see.
Article Image AI-generated.