
Macro & Crypto - Is the Bottom in? Version 1.0
Mar 8, 2023 - 5 min read

Whether the bottom is in or not – based on our macro and technical analysis, Bitcoin appears to be significantly undervalued at present and therefore in “Deep Value”, long-term accumulation territory.
Executive Summary
- BTC is trading at historically cheap levels, being significantly undervalued compared to its long-term trendlines.
- The economy is severely weakened: macroeconomic indicators point to a recession at some point as monetary indicators show constraints.
- Leading economic indicators have weakened and coincide with a recession such as TIPI, CLI and RPI.
- The crypto market is apathetic to bad news and recently recouped major long-term metrics, despite the first crypto and equity bear market concurring.
- BTC is in a historically low and undervalued price range, offering solid long-term entry prices in the current bear market.
1. An Introduction
The past two years have not been a pleasant time, neither for equity investors, nor for crypto investors, or for the economy in general. Markets crashed on all fronts, interest rates were hiked alongside elevated inflation, caused by macro troubles, and deteriorating sentiment, next to CeFi scandals in the crypto sector piling upon one another endlessly. But is it indeed mere gloom and doom, or have we all been biased by negativity and the »Bottom Is In« already? In order to establish a profound evaluation of the current situation, our view will be based on fundamentals and quantitative analysis, rather than feelings. We will take a deep dive into Bitcoin’s and the crypto market’s data via long-term logarithmic regressions. It will be balanced off with an in-depth analysis of the entire macro environment, economic data, leading indicators, as well as an aggregation of more than 60 years of historical data, including 8 prior recessions. Enjoy the first edition of our currently titled: »Is The Bottom In?« series.
1.1. Where Bitcoin is coming from
Over the past decade Bitcoin has grown more than four orders of magnitude, undergoing multiple cycles of FUD (Fear Uncertainty and Doubt) and FOMO (Fear Of Missing Out), always making sure to visit either end of the hype spectrum at least once in a respective market cycle. Fitting long-term logarithmic regression bands to BTC´s price progression yields an insightful picture and suggests, that BTC is relatively cheap at the moment, when compared to prior cycle lows. The lower bound of the logarithmic regression trend has historically never been undercut, not even during the 2020 crash.
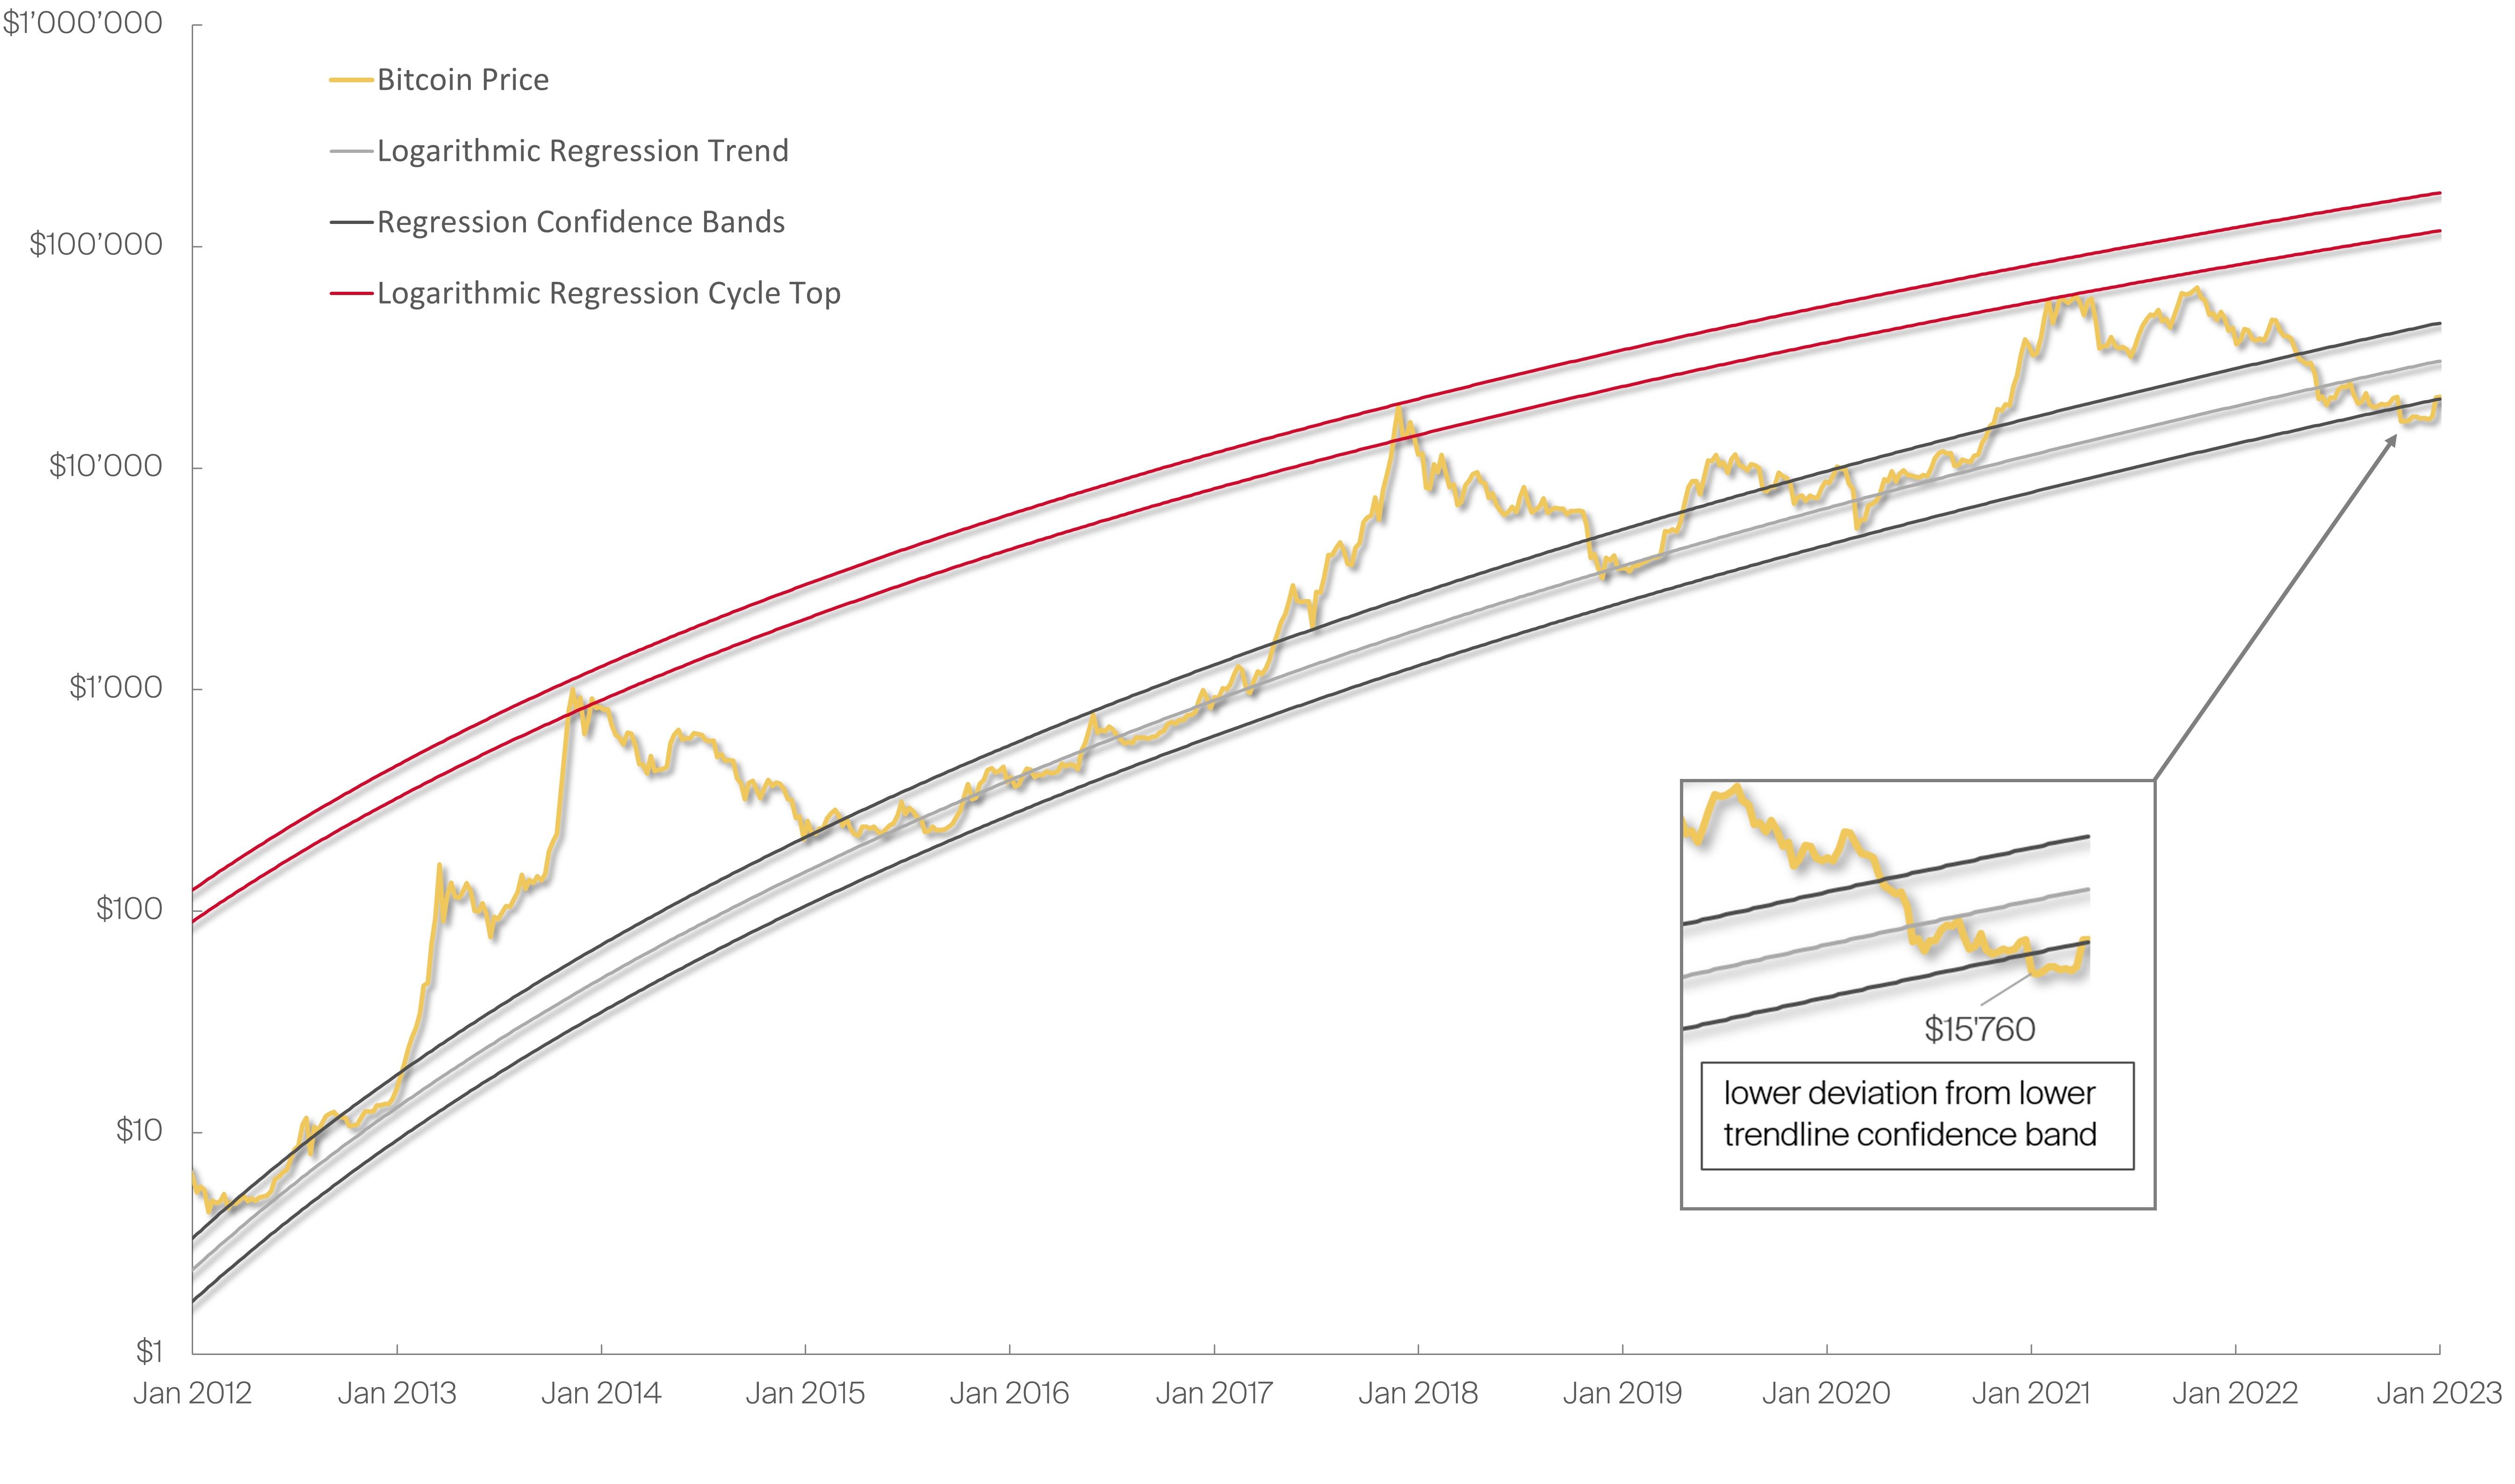
Notably, however, the past bubble stage has not seen significant overvaluations either.
1.2. So, how cheap is Bitcoin right now?
Inspecting the derived deviation of BTC´s current price versus its long-term logarithmic trendline purveys an almost homogenous picture. Bitcoin tends to return to an accumulation zone (green box) in every bear market thus far.
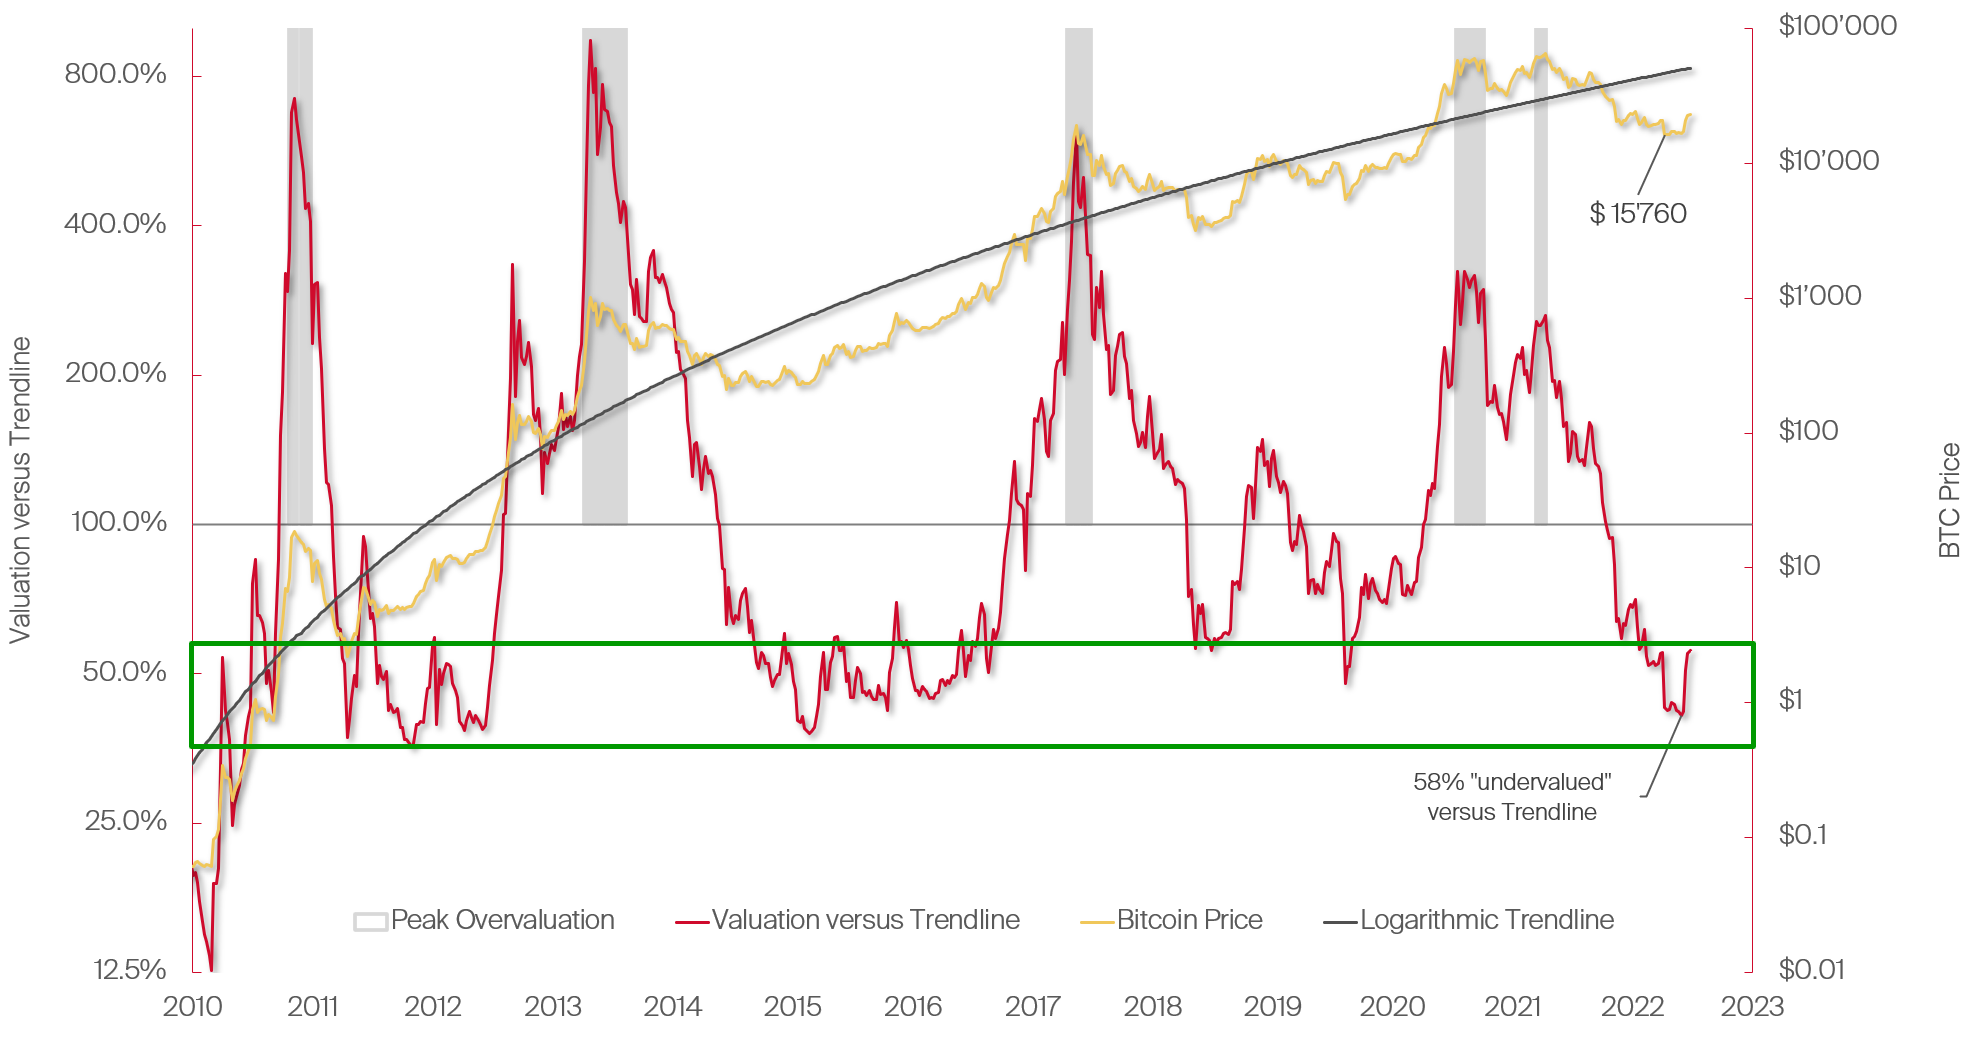
The general undervaluation versus its long-term valuation trendline is around 40-60%. The previous 2018-19’ bear market saw drawdowns of roughly 50% only. This puts the depths of the current drawback in line with the 2014-16’ crypto winter, lasting a full two years and being the most severe so far, seeing discounts as much as 60%. The long-term valuation trendline suggests a price of $50’000, implying BTC is currently 45% below its trendline. Historically, Bitcoin spends only 20% of its time being more than 50% undervalued (143 out of 653 weeks to date). Historically, this has been a good time to stack Sats (Satoshis), given BTC’s long-term price trend.
2. The role of Macroeconomics
The expectation of a recession might not appear too far-fetched given how rigorous central banks have hiked the interest rates since last year as a response to out of control, mostly double-digit, “temporary inflation”. As a result, real yield, i.e., the actual interest earned after accounting for loss of purchasing power due to inflation, have been negative for almost a decade at this point, recently plummeting to lows not seen for more than 60 years. Also, yield spreads, so the difference between 10-year and 2-year government treasury bonds, has turned negative, resulting in an inverted yield curve (see info box: The Dilemma with the Yield Curve). Lastly, we are observing the steepest FED Funds Rate hike of recent economic history.
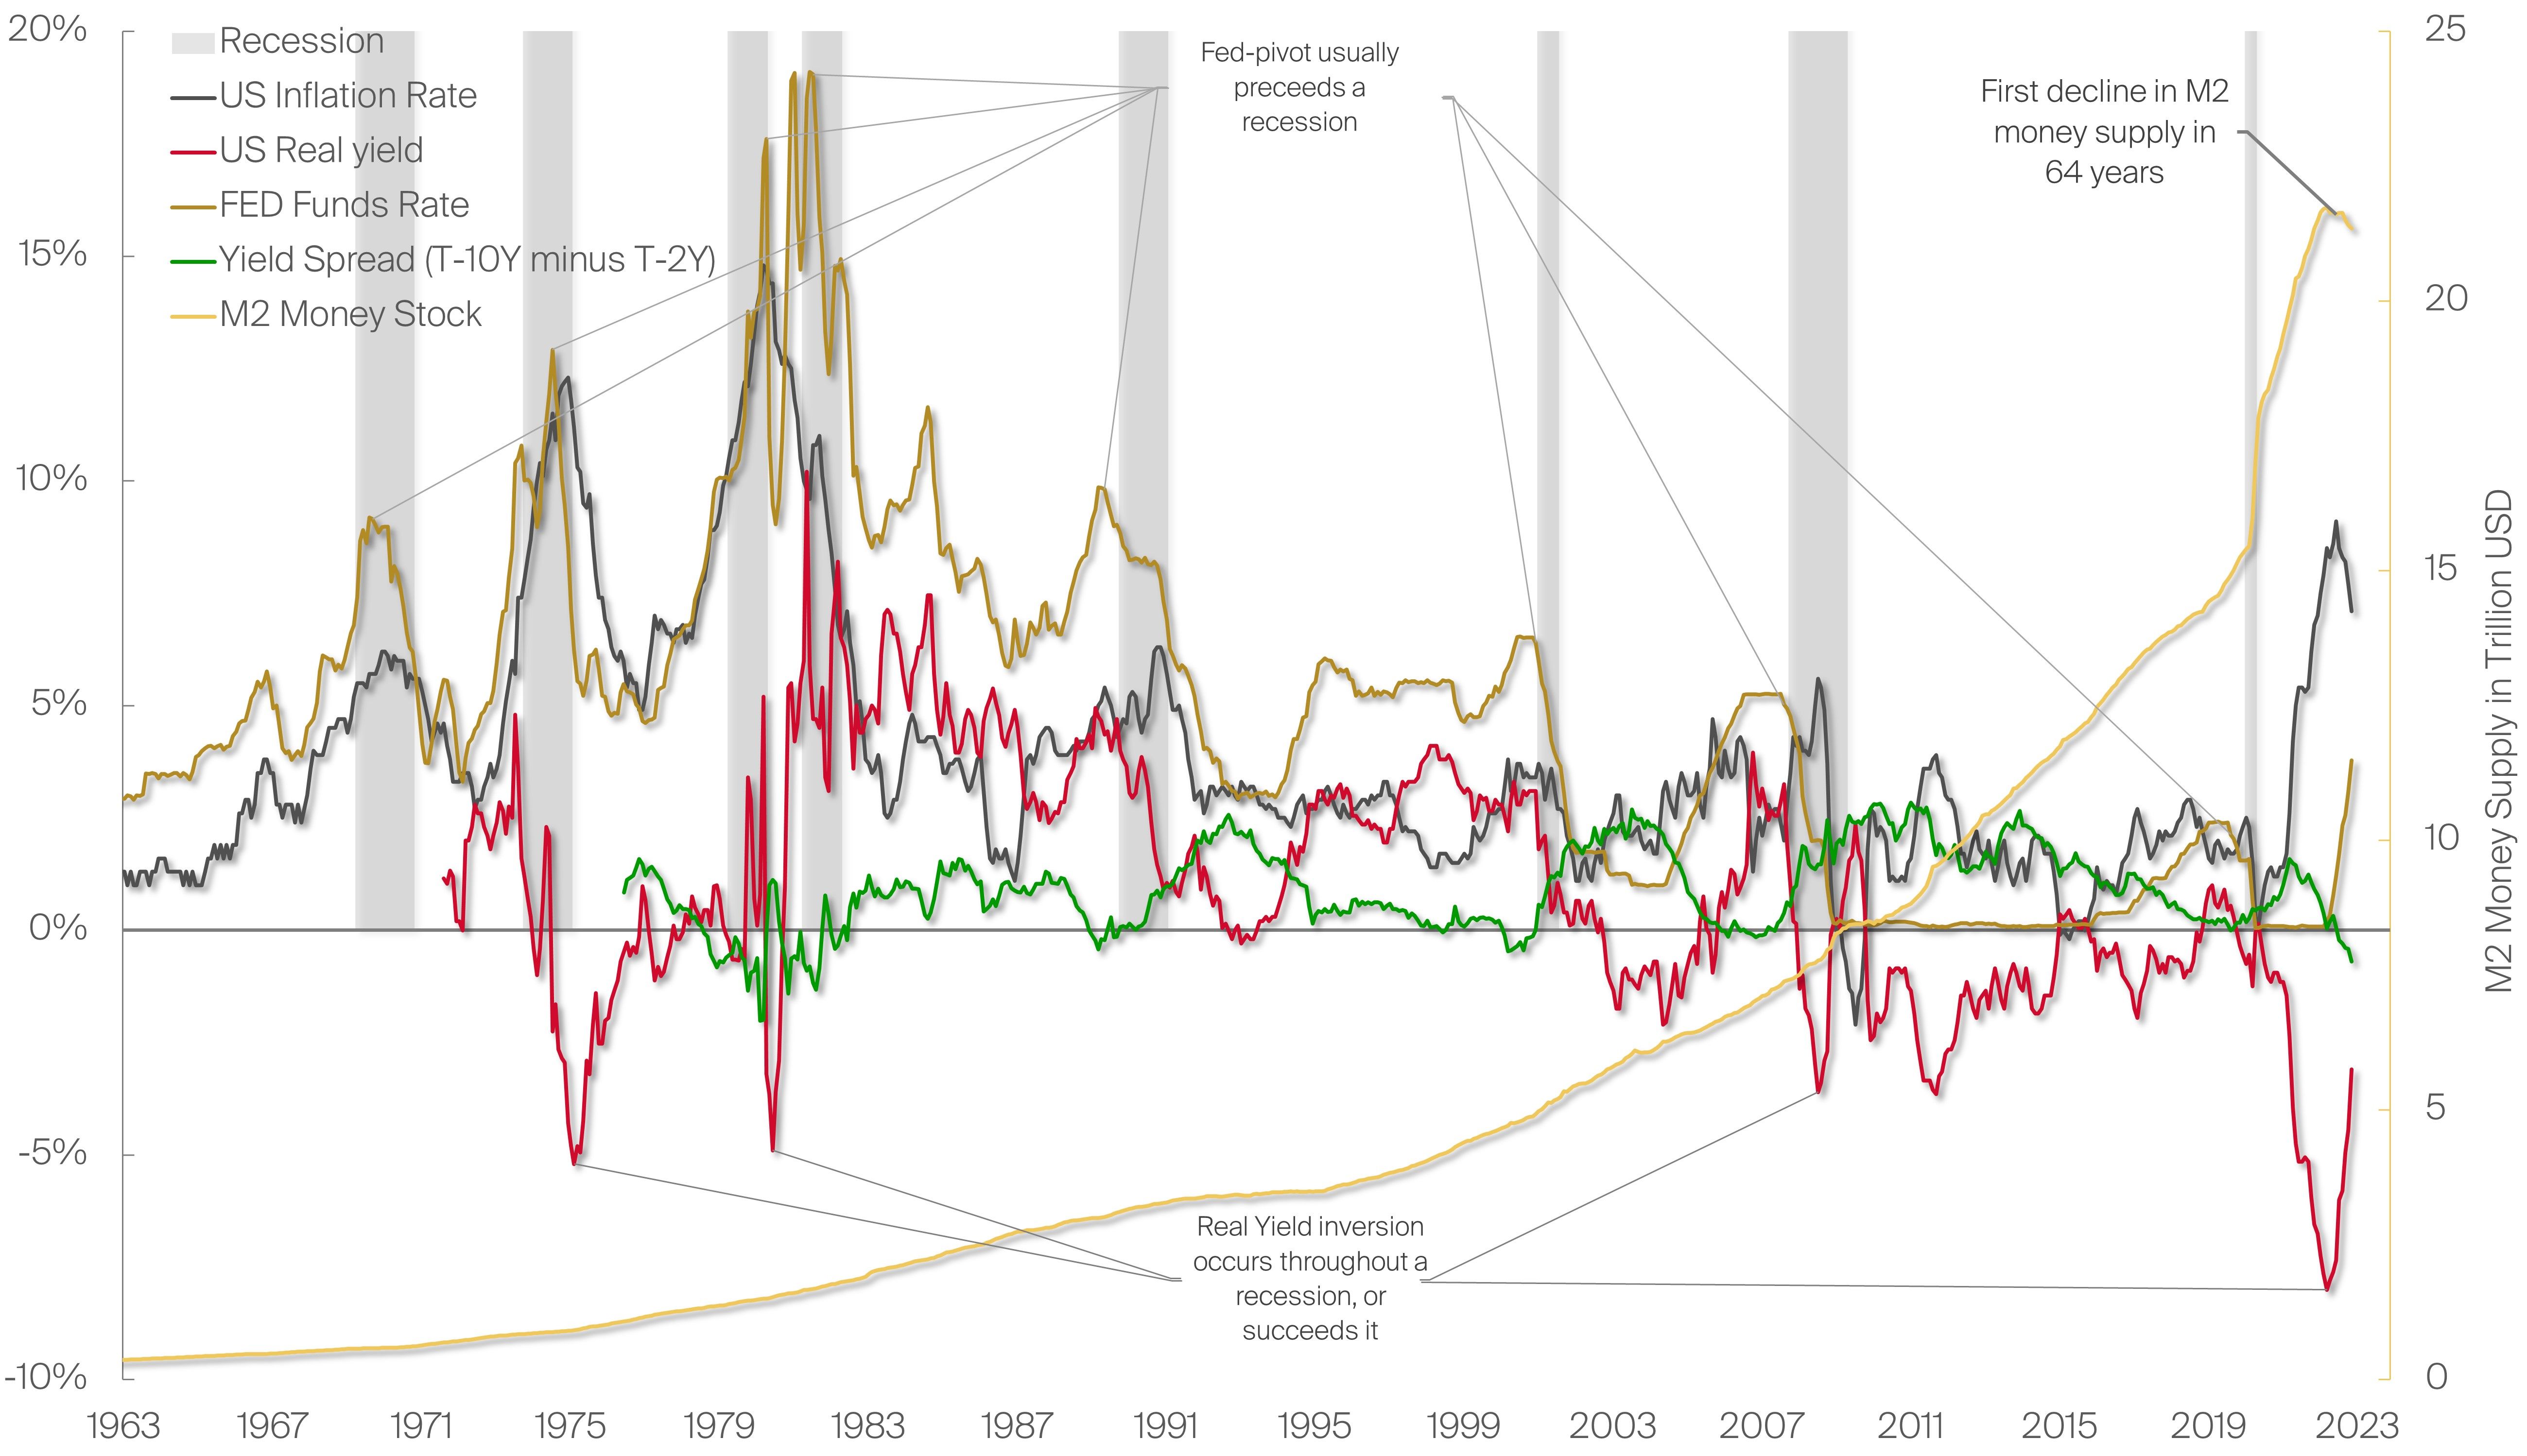
Overlaying the data with the recessions of the past shows that recessions usually occur, or get declared retrospectively, when the mentioned macro indicators behave in the following way: (1) inflation rates have peaked and are on their way to recover (2) interest rates are raised and more dovish policies are in sight and/or implemented already (3) real yields pick up as a consequence and revert upwards to often healthier levels (4) yield spreads have turned negative, i.e. an inverted yield curve occurs. Currently, all four indicators are aligning, pointing towards a recession, when considering that (2) is already in sight. This is due to markets pricing in less rate hikes and more dovish interest rate policies to some extent (evident by 2-year treasury constant maturity rate being lower than the effective federal funds rate, i.e., market participants price in a reversal).
3. But is a recession really that bad?
Backing off from the monetary indicator side of macroeconomics and focusing on actual economic indicators and data, a similar story unfolds. All major economic activity is traced by the Total Industrial Production Index (1) (TIPI), aggregating outputs from industries such as manufacturing, mining (not Bitcoin mining), public utilities and infrastructure. Another metric to watch closely is the Composite Leading Indicator (2) (CLI) which helps navigate the stage of the business cycle and is composed of several economic indicators including business sentiment, industrial production, consumer confidence […]. Lastly Real Personal Income (3) excluding transfer payments (RPI), i.e., without government handouts, measuring the true income of people.
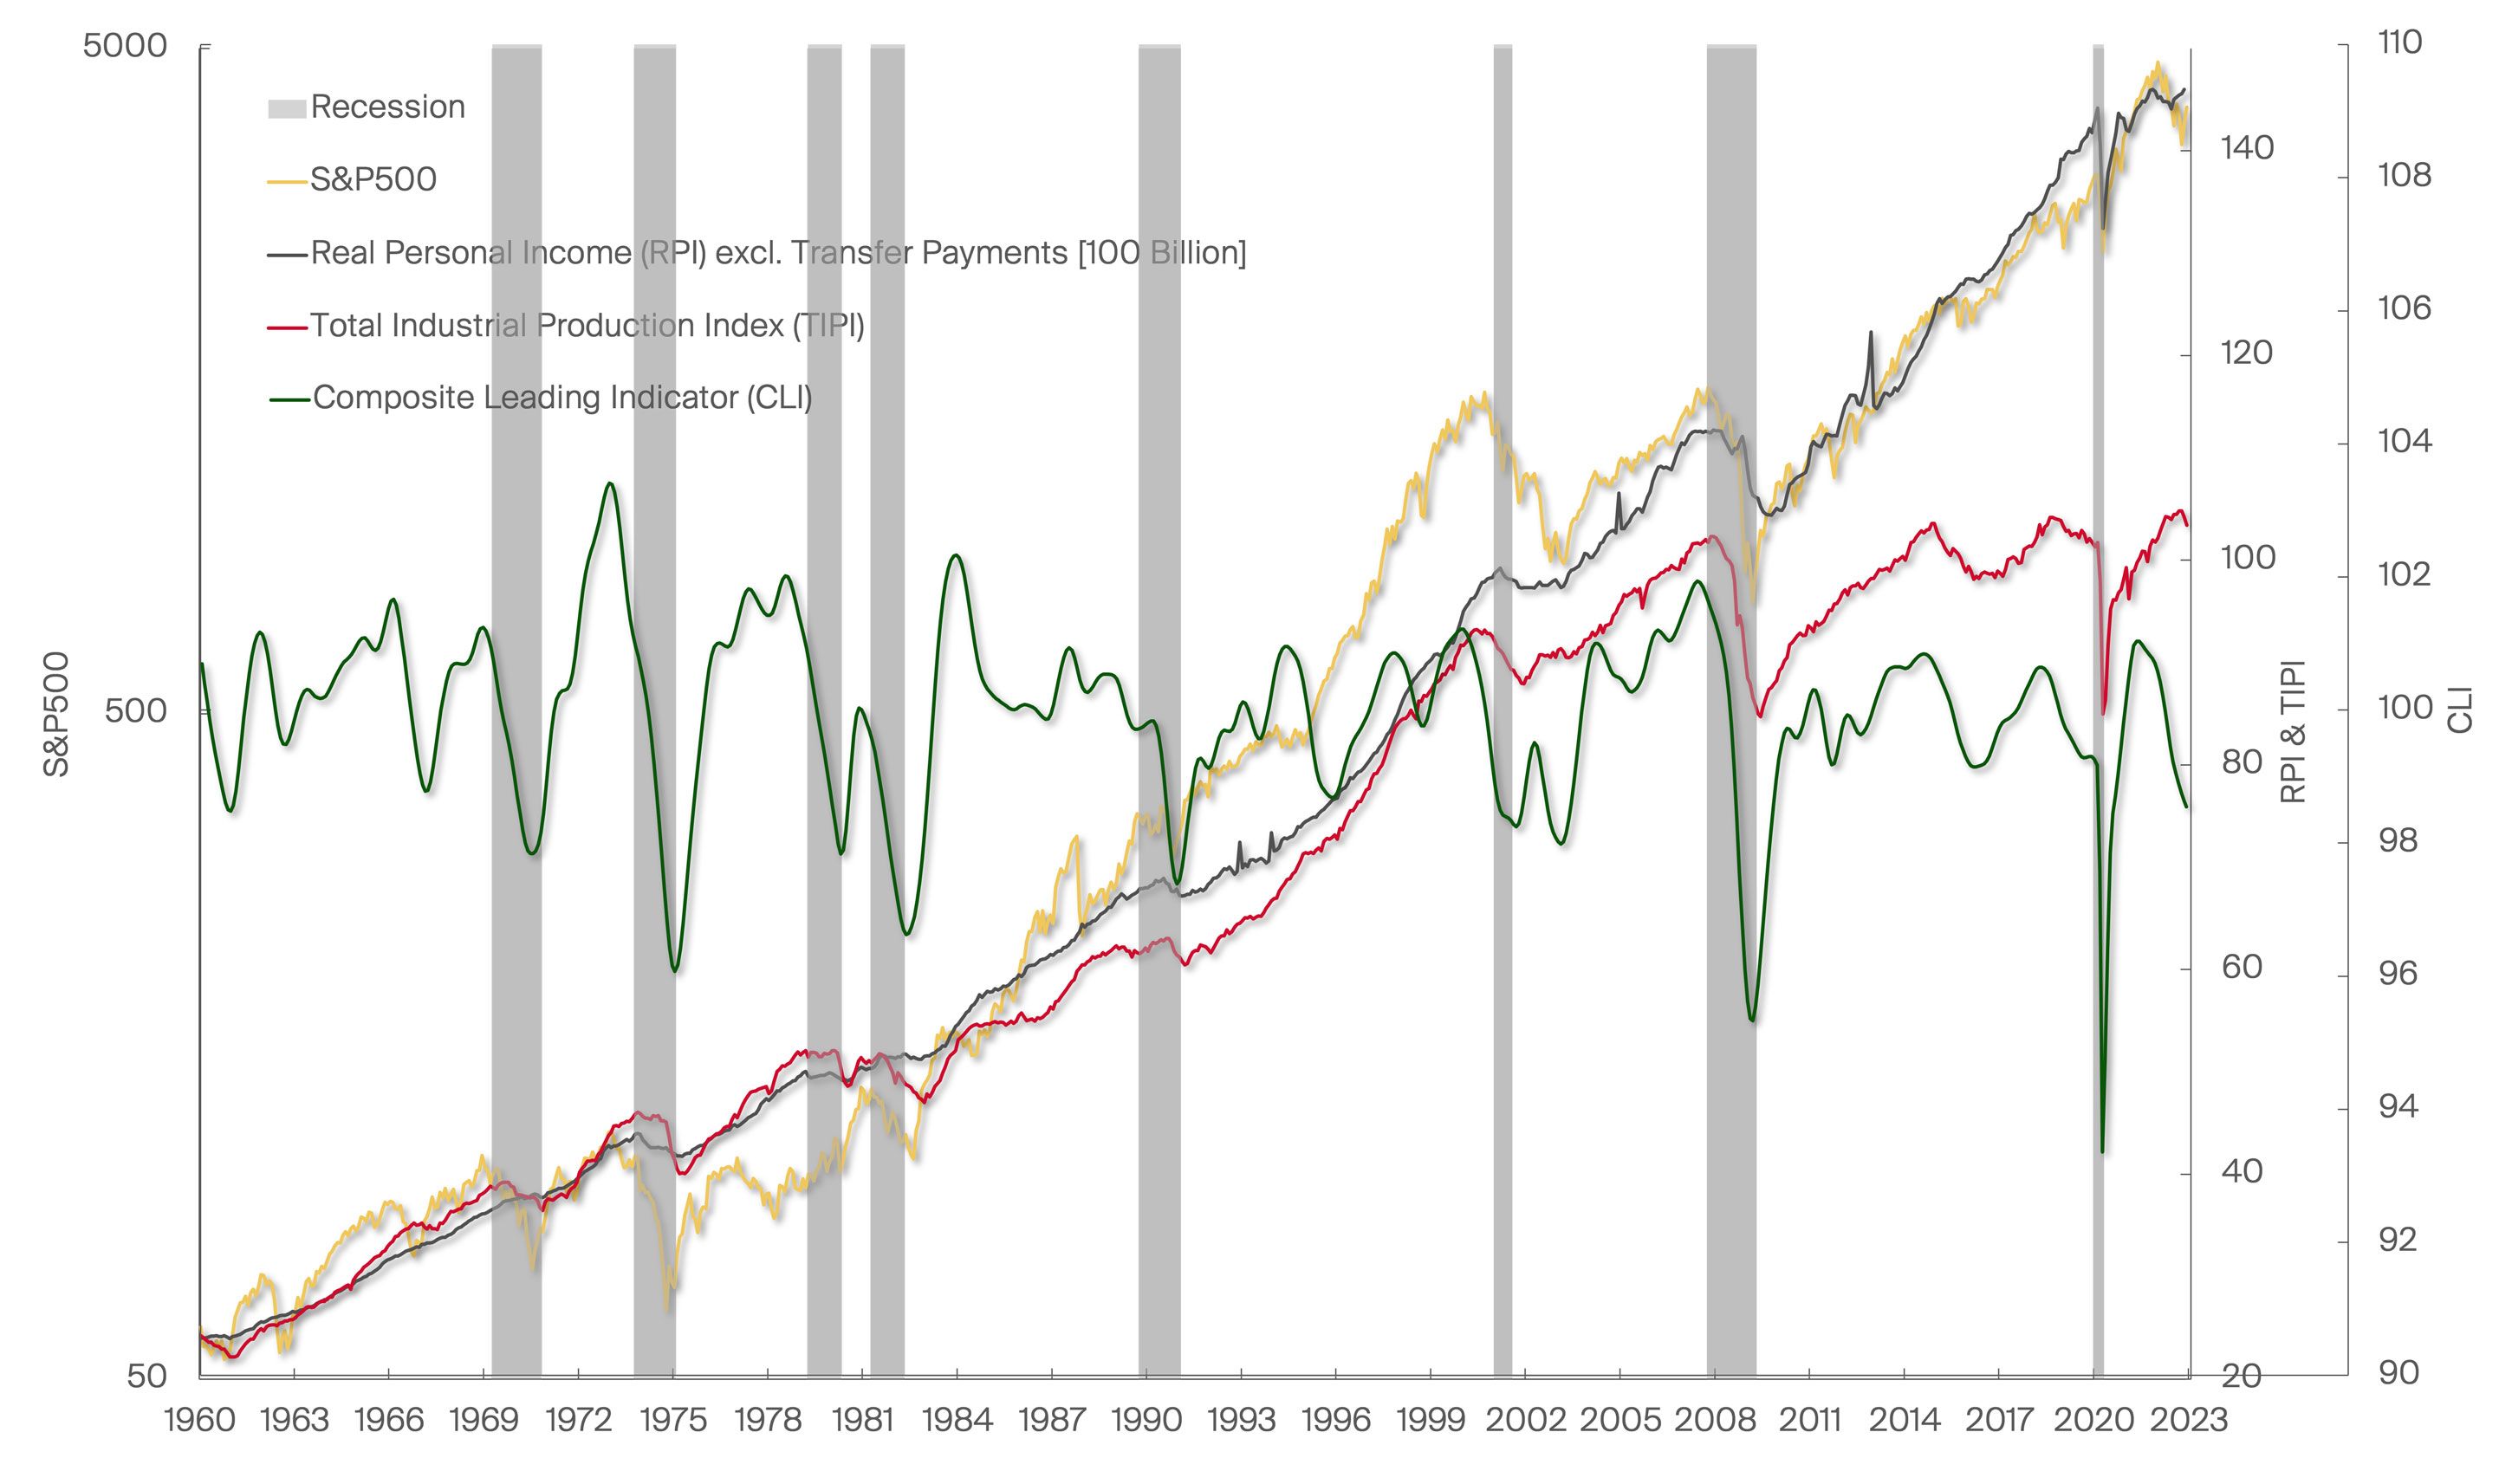
Historically, significant declines in the CLI coincide with recessions, the steeper the drawback the more likely the recession occurred. Furthermore, TIPI has been on a plateau and appears weakened, suggesting a reversal soon. Also, RPI has flattened out and has barely recouped pre 2020 crash levels. Aggregating the data provided the economic outlook and recession probability looks bearish, gloomy at best. However, keeping in mind that recessions get declared retroactively, i.e., amidst the recession or even afterwards, if short lived, the worst might not be yet to come in this instance. All things considered the largest drawbacks, historically, occurred by the time we got into a recession. This implies, that though further drawbacks are always a possibility, we are already far from previous all-time-highs and in low priced territory. This grants the opportunity to open long-term positions at relatively low valuations.
The Dilemma with the Yield Curve
Due to the most recent FED rate hikes the interest paid on short-term treasury bonds increased, whereas the yields on long-term bonds are slower to pick up the change in the interim. Interest rates on the short end of the yield curve rise faster than those on the long end, causing the infamous inverted yield curve, depicted in grey below, compared to a “normal” upward sloping yield curve as depicted in red. Only once the interest rates are not hiked anymore, the yield curve slowly normalizes and interest rates trickle through towards the long end of the yield curve, reverting it back to normal – upwards sloping.
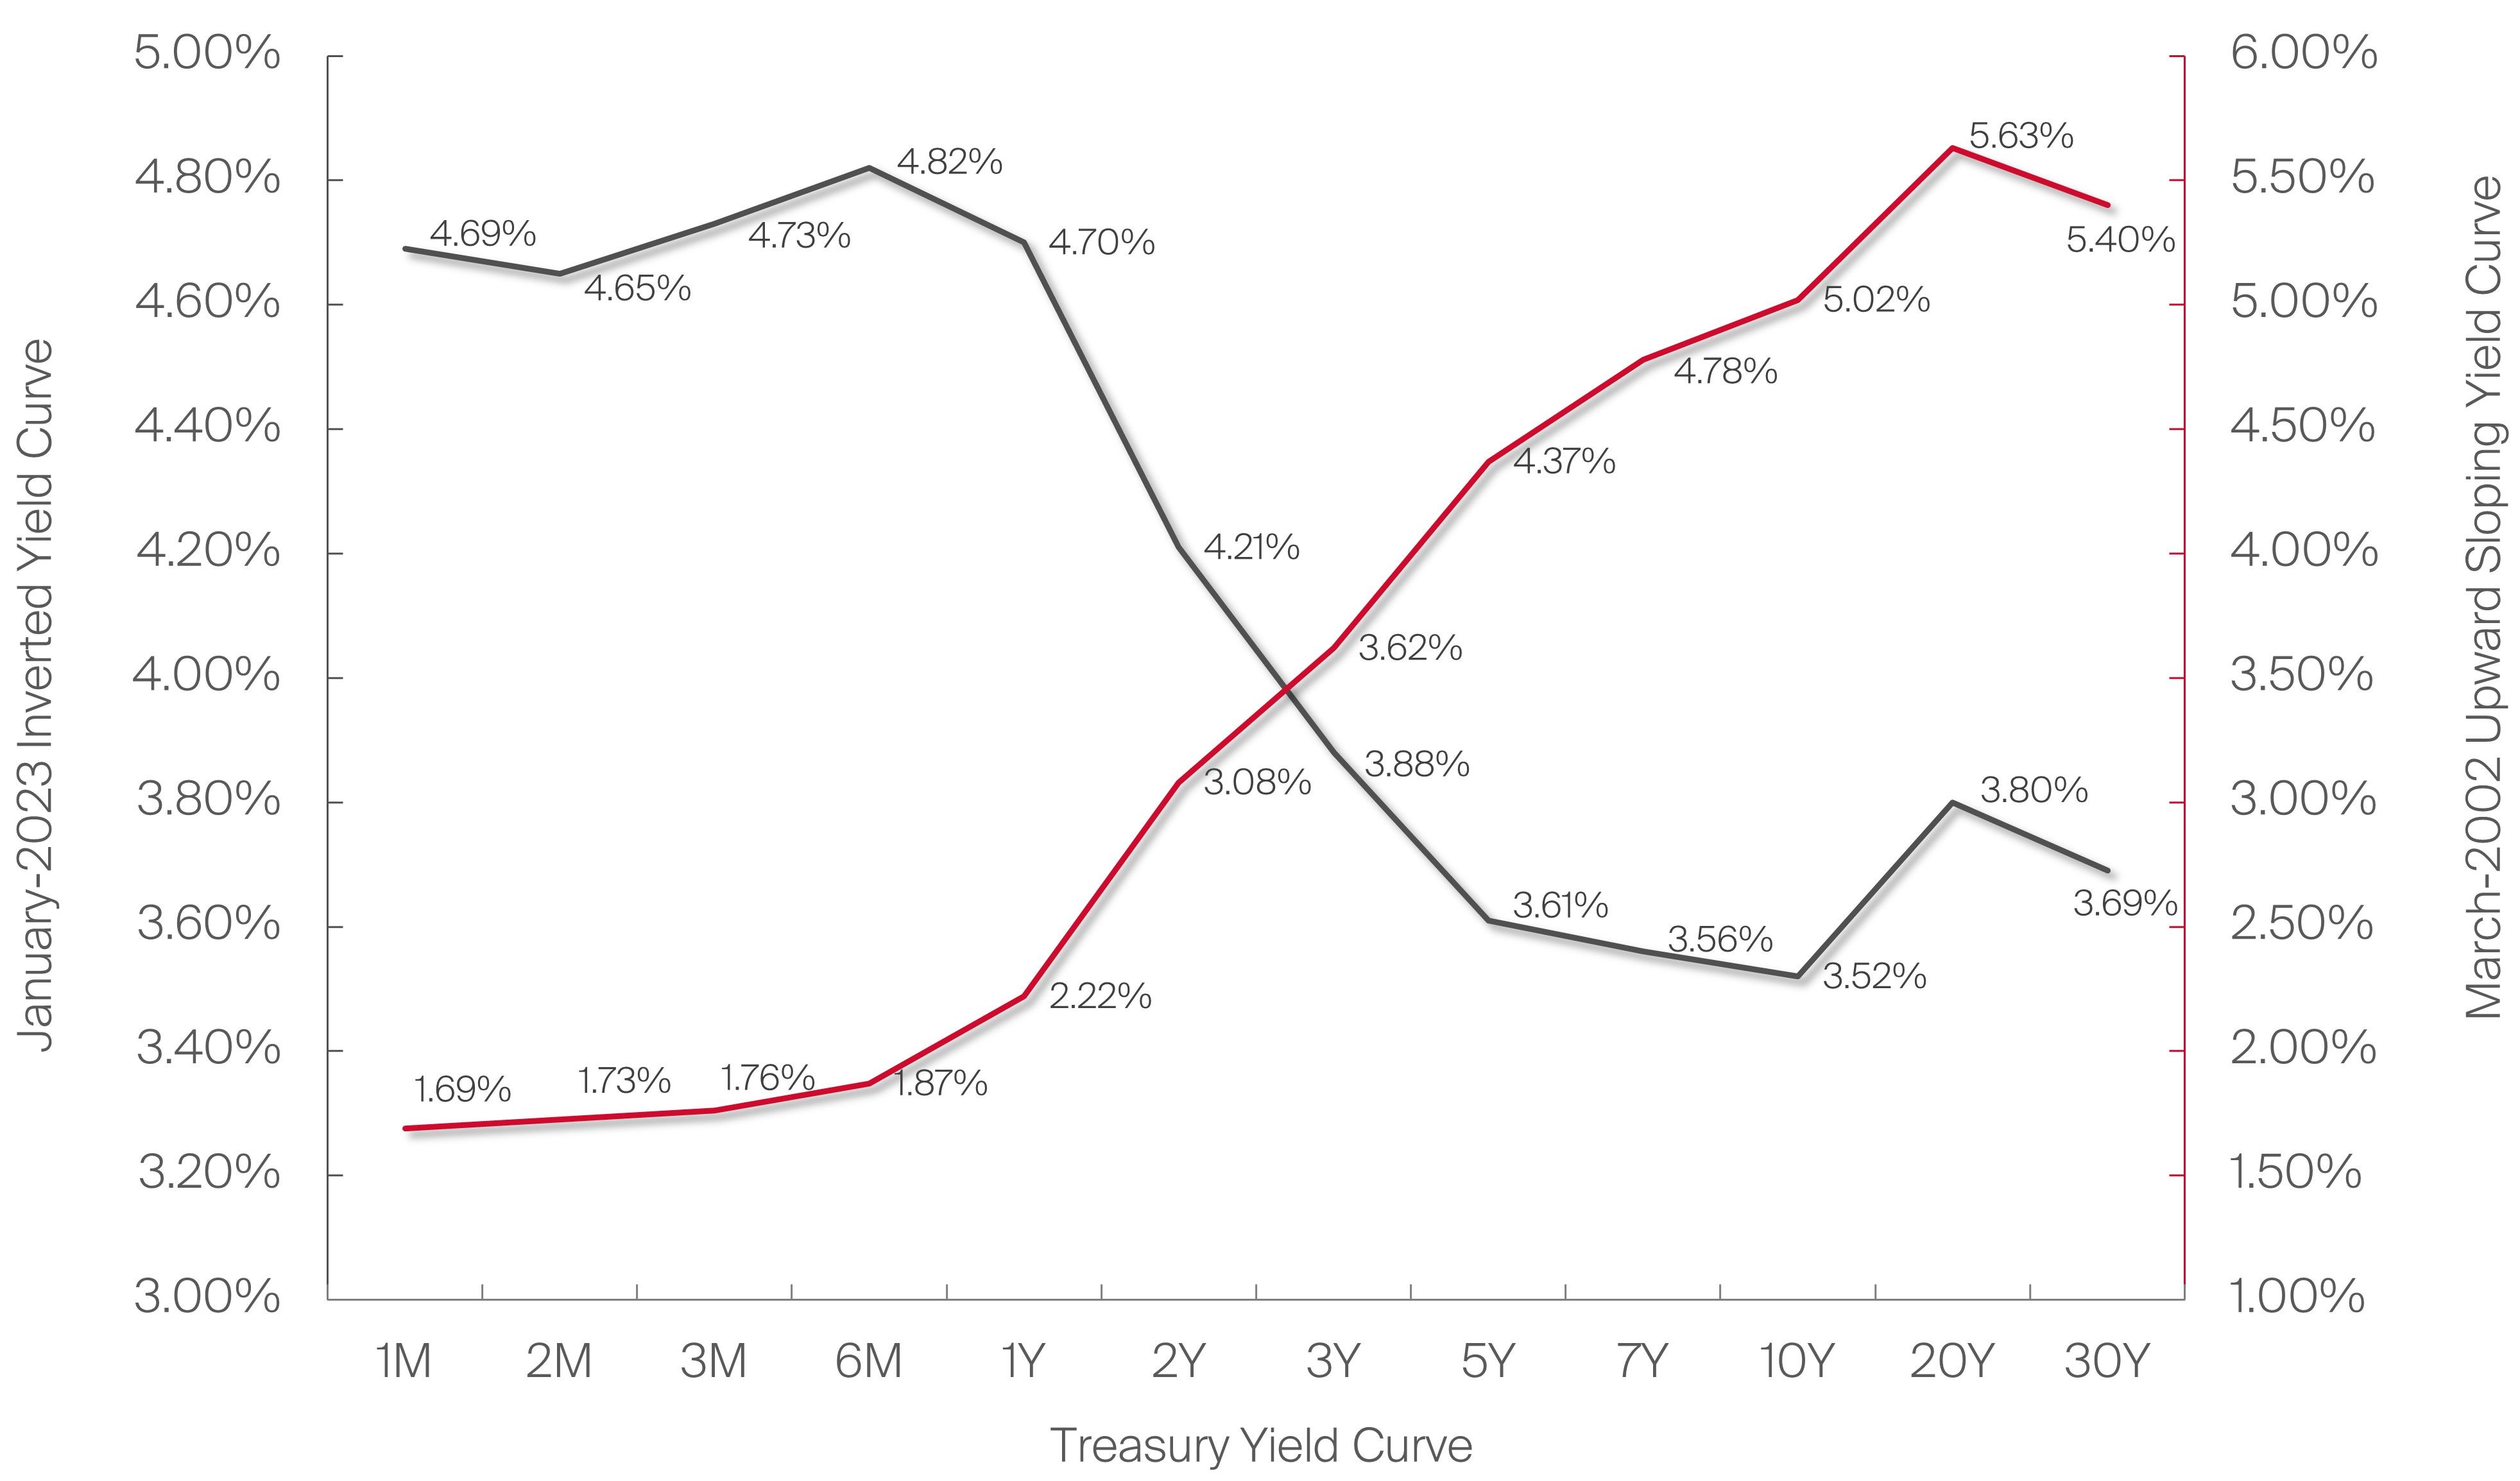
The actual problem starts when reflecting upon history: A yield curve has almost never normalized without a recession occurring. The few individual exceptions that did not lead to a recession, subpar economic growth was the consequence.
4. Is there a catch?
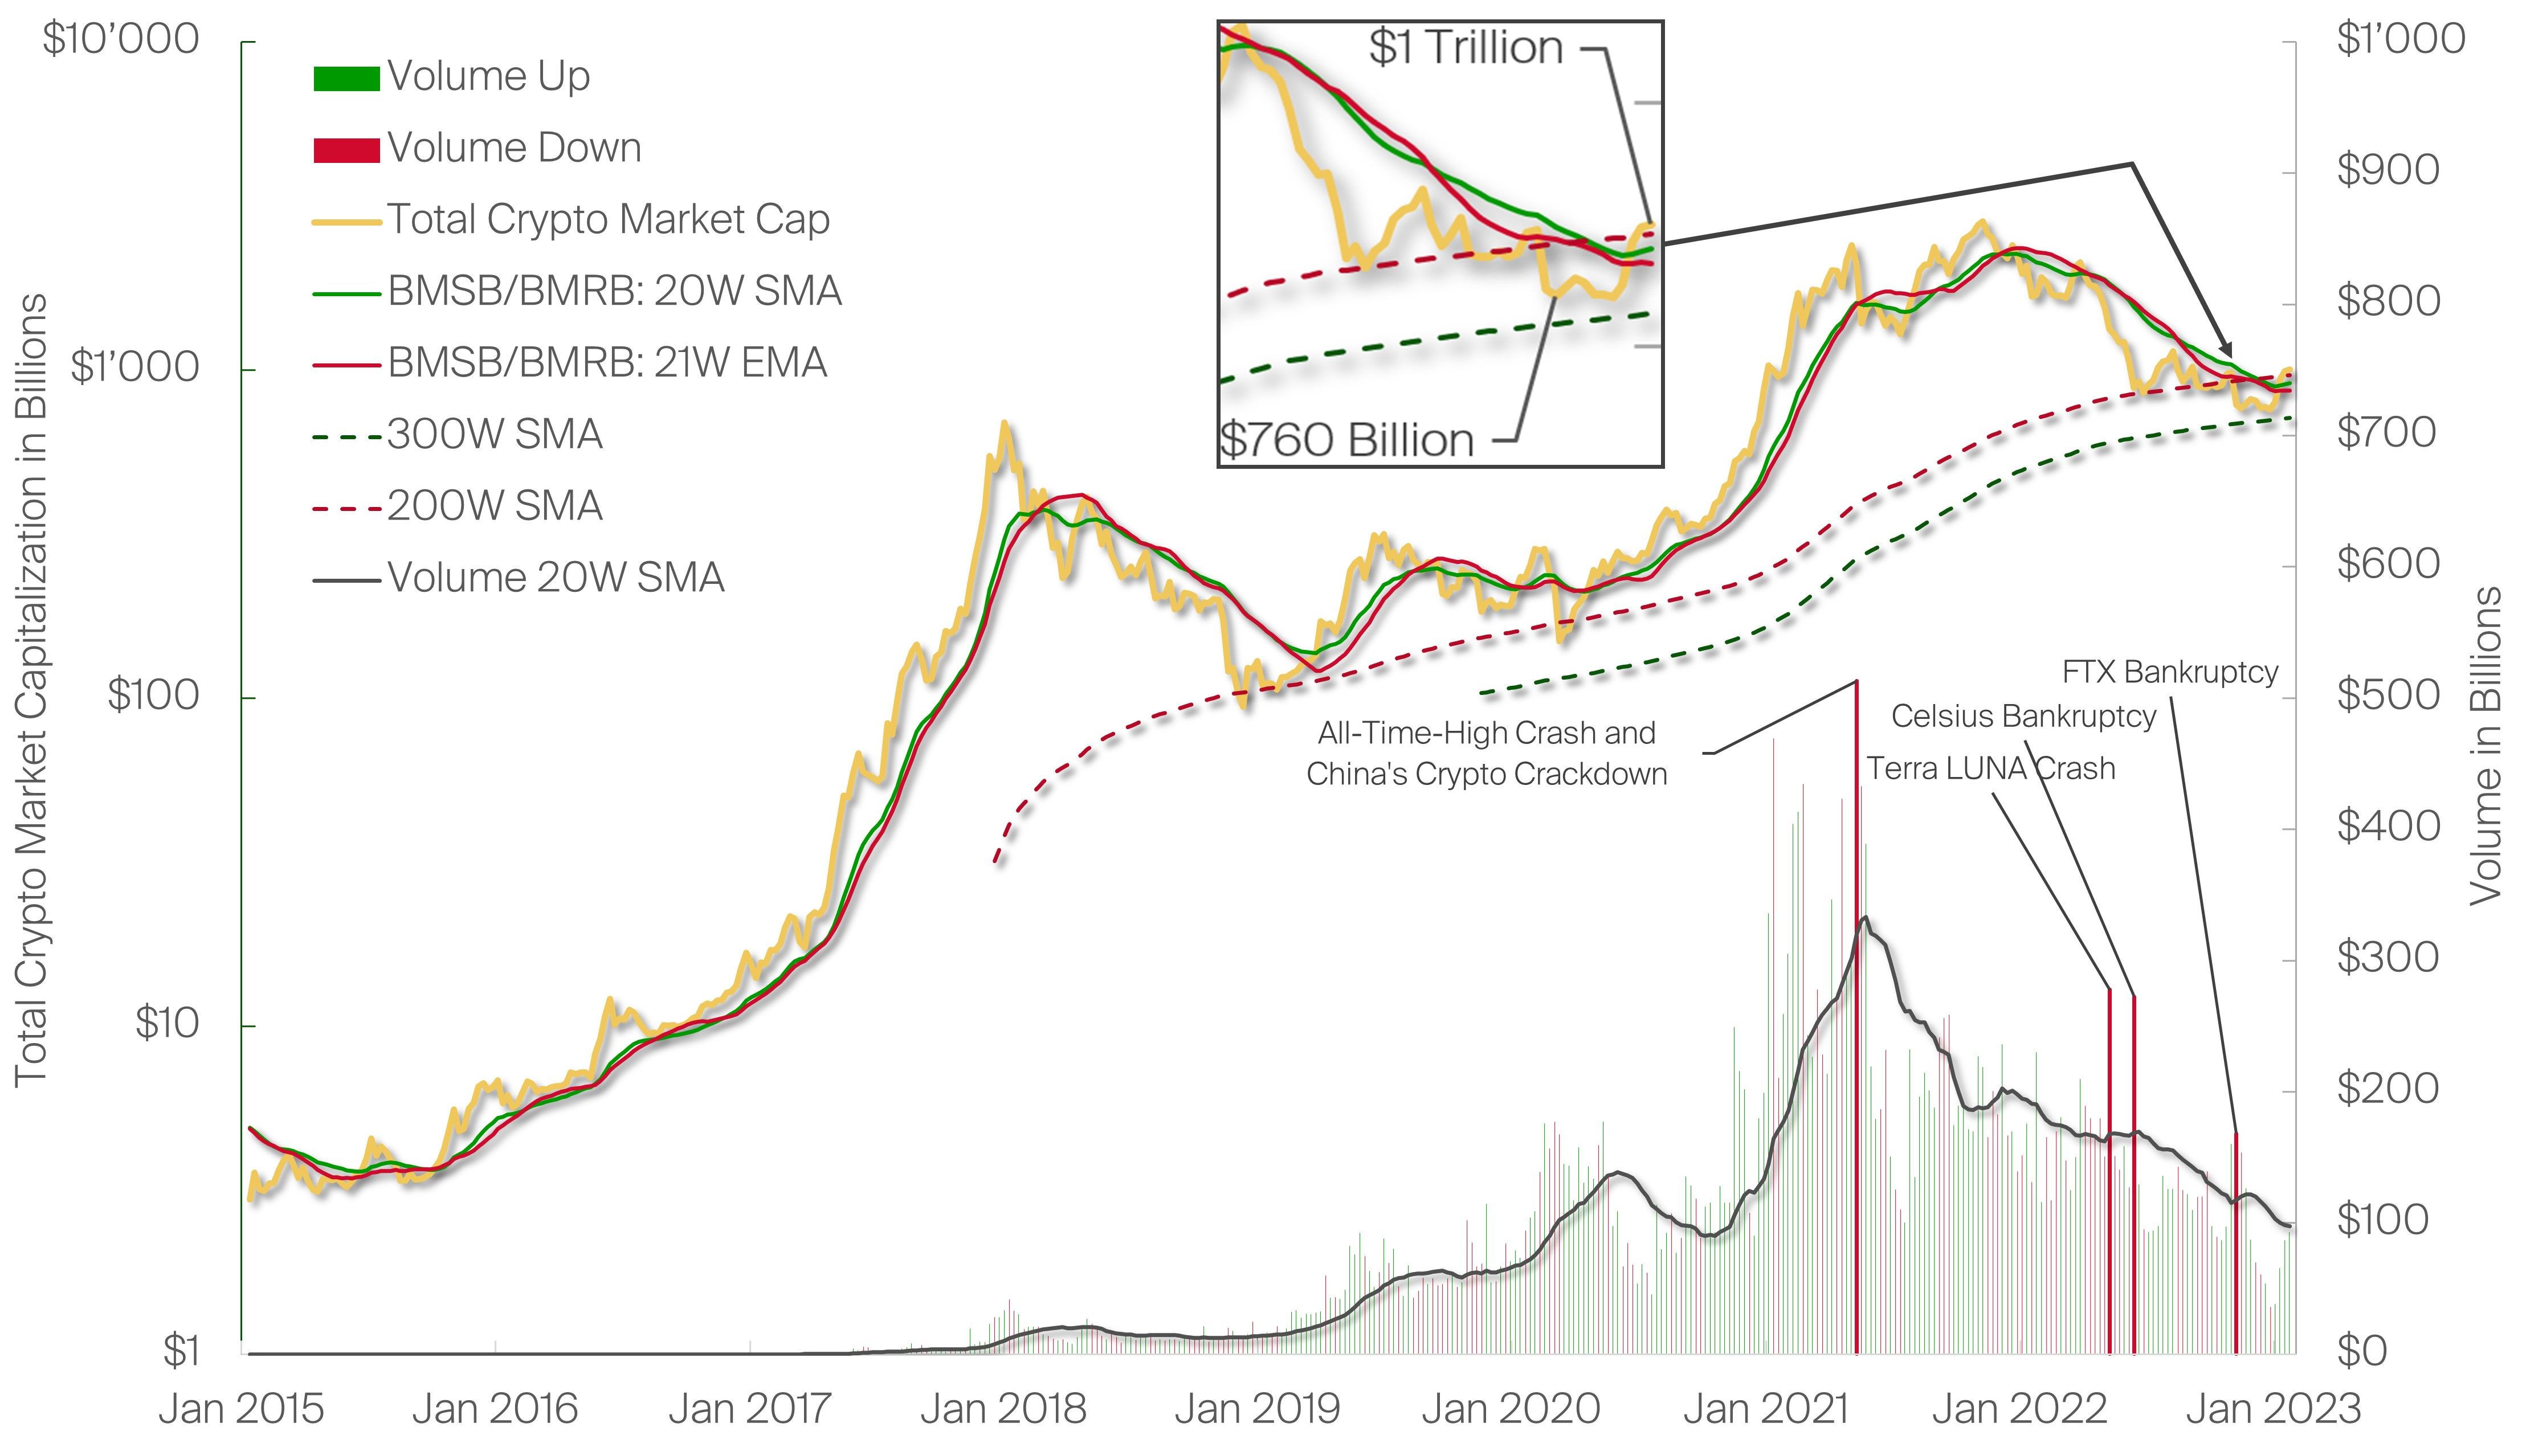
Stating that crypto has seen it all is probably an understatement at this point. Crypto went from tremendous volumes and crashes amidst China´s crypto crackdown, or the Terra and Celsius collapse, combining media sensitivity and intraday volatility with severe market corrections to growing thick callous, and being apathetic to the biggest fallout to date, the FTX scandal, barely worth the volume and a price drawback. The crypto sector, by its Total Market Cap, managed to recoup several key levels and long-term indicators, such as Bull Market Support Bands (BMSB) / Bear Market Resistance Bands (BMRB), including the 200- and 300-week simple moving average. Looking at previous cycles, BTC has been trading below major levels solely short periods of time, with few retests. Though history does not repeat, it often rhymes, while we must keep in mind, that at some point there may always be a first incident, where this time it is different. Another thing to keep in mind: Bitcoin was born in a financial crisis. Whether the bottom is in or not – based on our macro and technical analysis, Bitcoin appears to be significantly undervalued at present and therefore in “Deep Value”, long-term accumulation territory.
5. A disclaimer from the author and Bitcoin Suisse
We hope you enjoyed the first edition of our currently titled »Is the Bottom in?« Series, which will be published frequently throughout the near future. The goal will be to analyze and assist in guiding the different macroeconomic and crypto market phases. Though current price levels offer good long-term entries to establish solid crypto portfolio positions, a word of caution is necessary. With an eye on the most recent crashes and fallout of CeFi in crypto, there is further risk of contagion. The next malicious, dishonest, or overleveraged actor, can drag down the next one with him. We are far away from the highs of the bull market and seen many lemons flushed out of the markets so far. The good and honest players remain, which is why we at Bitcoin Suisse focus on rationality, transparency and refraining from jumping on the next big hype or trying to maximize profit with leverage or risky endeavors. Please do your own research and your own due diligence when making any type of investment decision. Historically speaking, bear markets only last temporarily, and beaten down price levels offered attractive long-term investment opportunities in the past.
Denis Oevermann
Investment Analyst / Crypto Researcher