Valuation of DeFi Tokens
Feb 16, 2021

The decentralized finance (DeFi) sector continues to be one of the best performing ones in the crypto markets. This may be surprising at first glance, since many DeFi tokens focus mostly on the governance of protocols or have even been called “valueless” by their creators. However, some of the tokens already generate cash flows and traditional discounted cash flow valuations might be applicable. Others may generate cash flows for their token holders in the future, enabled through governance decisions. This episode highlights a few metrics that could help estimate how the market currently values various projects.
Fees Paid in DeFi
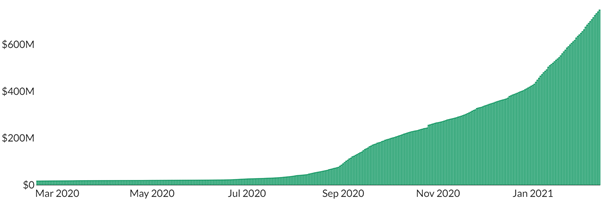
The total amount of fees that have been paid in DeFi so far is on its way to $1 billion and growing rapidly. Since the beginning of this year, about $7 million in fees accrued on average every day on major DeFi protocols.
Illustration 1: More than $750 million in fees have been paid to decentralized finance protocols.
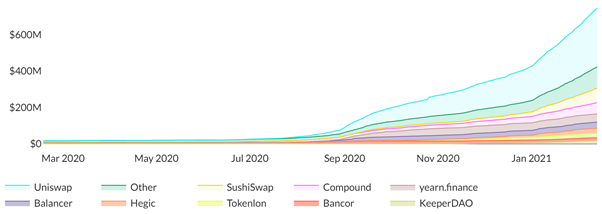
Of those fees, a major part (ca. 50%) went to decentralized, automated market maker-based (AMM-based) exchanges Uniswap and its fork Sushiswap.
Illustration 2: Decentralized exchange Uniswap captured the lion’s share of the total amount of fees paid to DeFi protocols so far, at around 44%.
Since these revenues shown in Illustrations 1 and 2 are simply the sum of all fees paid to a protocol, it is important to understand how much of the value accrues to token holders, and how much is paid to protocol participants (such as liquidity providers on Uniswap or lenders on Compound). Many protocols currently choose not to extract a protocol fee and fully distribute the revenue to participants. It is indeed an open question how much rent-seeking by a protocol would be possible in a maximally efficient, open, and global market such as is present with public blockchains, since only strong network effects can counteract the danger of a protocol being forked and fees or superfluous protocol tokens removed. A variant of this has been illustrated with Uniswap and Bancor, whose models were similar, but Uniswap used ETH as its medium of exchange, whereas Bancor used BNT. As such, game theory dictates that the winning protocols are highly efficient, and only extract minimal rent.
[…] because the Maker protocol is so efficient, itself it needs to take only a very small cut of what is paid out in DSR and what is earned in stability rates.
Rune Christensen
Price-to-sales Ratio
Traditionally, the price-to-sales ratio – a company’s market cap divided by revenue – can be useful in valuing early-stage growth stocks. The methodology can be applied to DeFi tokens as well (Illustration 3).
Illustration 3: The price-to-sales ratio (market cap divided by collected fees) varies greatly for various DeFi protocols, ranging from more than 200 (ZRX, IDEX) to less than 20 (e.g. COMP, UNI).
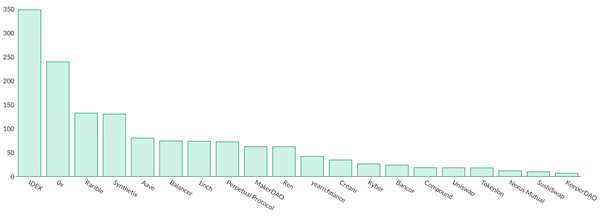
This metric varies greatly across different sectors. The highest ratios of more than 200 are obtained for orderbook-based decentralized exchanges IDEX and 0x (ZRX), whereas AMM-based Uniswap and Sushiswap stand at 18.4 and 10.0, respectively. For the money market protocols, Compound (18.7) is valued less aggressively than Aave (80.5) – it is noteworthy, however, that Aave offers different functionalities such as flash loans, which have been a significant source of protocol income.
Is Total Value Locked Useful?
The total value locked (TVL) in DeFi has passed $40 billion and continues to grow (Illustration 4). As one of the simpler metrics to track on a protocol level, the question arises: Is there a useful correlation between market cap and TVL (Illustration 5)?
Illustration 4: The total value locked in many DeFi-related protocols has been consistently growing throughout December and January.
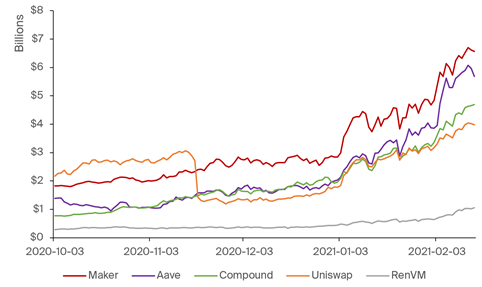
Illustration 5: The ratio of market cap divided by total value locked is currently lowest for Maker (0.35), and highest for Uniswap (1.58) in the selection of tokens shown below.
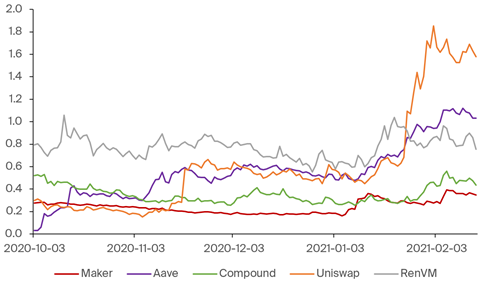
In Illustration 5, an increasing ratio indicates that the market cap of the protocol has been outpacing its TVL growth, and vice versa. In general, while the overall trend of TVL of a protocol and its market cap seem to correlate, even drastic short-term changes in TVL do not seem to be reflected in the market cap. An example of this would be the end of UNI liquidity mining on Uniswap in mid-November, where its total value locked dropped from ca. $3 billion to $1.3 billion, but its market cap remained (relatively) stable.
Correlations to BTC and ETH
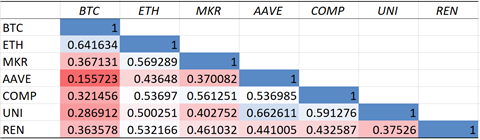
While these metrics may be interesting to watch, the performance of DeFi overall still seems to strongly depend on the overall market dynamics in place. As they are native to the Ethereum network, they show a significant correlation to the price movements of ETH (Illustration 6) – less so to BTC, although short term correlations tend to increase during market corrections. As such, the strong performance of DeFi as a sector currently appears to depend on overall market strength.
Illustration 6: DeFi tokens have been more strongly correlated to ETH rather than BTC. During market downturns, correlations tend to increase.
Conclusion
Determining accurate valuation methodologies for newly launched tokens, such as the many newcomers on the crypto stage of 2020, is difficult due to uncertain growth trajectories. Both traditional valuation methodologies as well as new, distinct metrics for quantifying growth might be useful. DeFi protocols resemble early stage fintech start-ups, with unclear, but potentially large, total addressable markets. Another crucial question in the long run will be how much rent such protocols can extract and funnel back to the holders of governance tokens. This will be interesting to watch as crypto matures and the innovations of the space slowly find their way into mainstream.