The Bitcoin halving, occurring approximately every four years, has been a pivotal event in the market dynamics of Bitcoin and the whole crypto market. As the issuance of new Bitcoin is halved, the event has historically been associated with significant impacts on the crypto market and its cycles. Analyzing the time-based cyclical patterns around the previous Bitcoin halvings reveals intriguing insights on how the halving could be one of the drivers behind Bitcoin’s market dynamics.
Since its genesis block in 2009, the Bitcoin network has experienced three halvings and in the past, the Bitcoin halving combined with a constant or increasing demand for Bitcoin has so far tended to put upward pressure on the price. Up until the present, the market experienced a surge in bullish sentiment in the lead-up to the halving, driven by anticipation of the supply reduction. This pattern suggests a cyclical nature, with the halving acting as a potential catalyst for Bitcoin and crypto market cycles.
We conducted an analysis of the first three Bitcoin halvings and the market cycles which accompanied the market development since then in regard to time pivots. We focused on quantifying the temporal intervals between each halvings and the subsequent Bitcoin market cycle price peak, followed by the durations from the Bitcoin market cycle price peak to the following Bitcoin market cycle bottom, and ultimately from the price bottom to the subsequent halving.
Bitcoin halving cycles
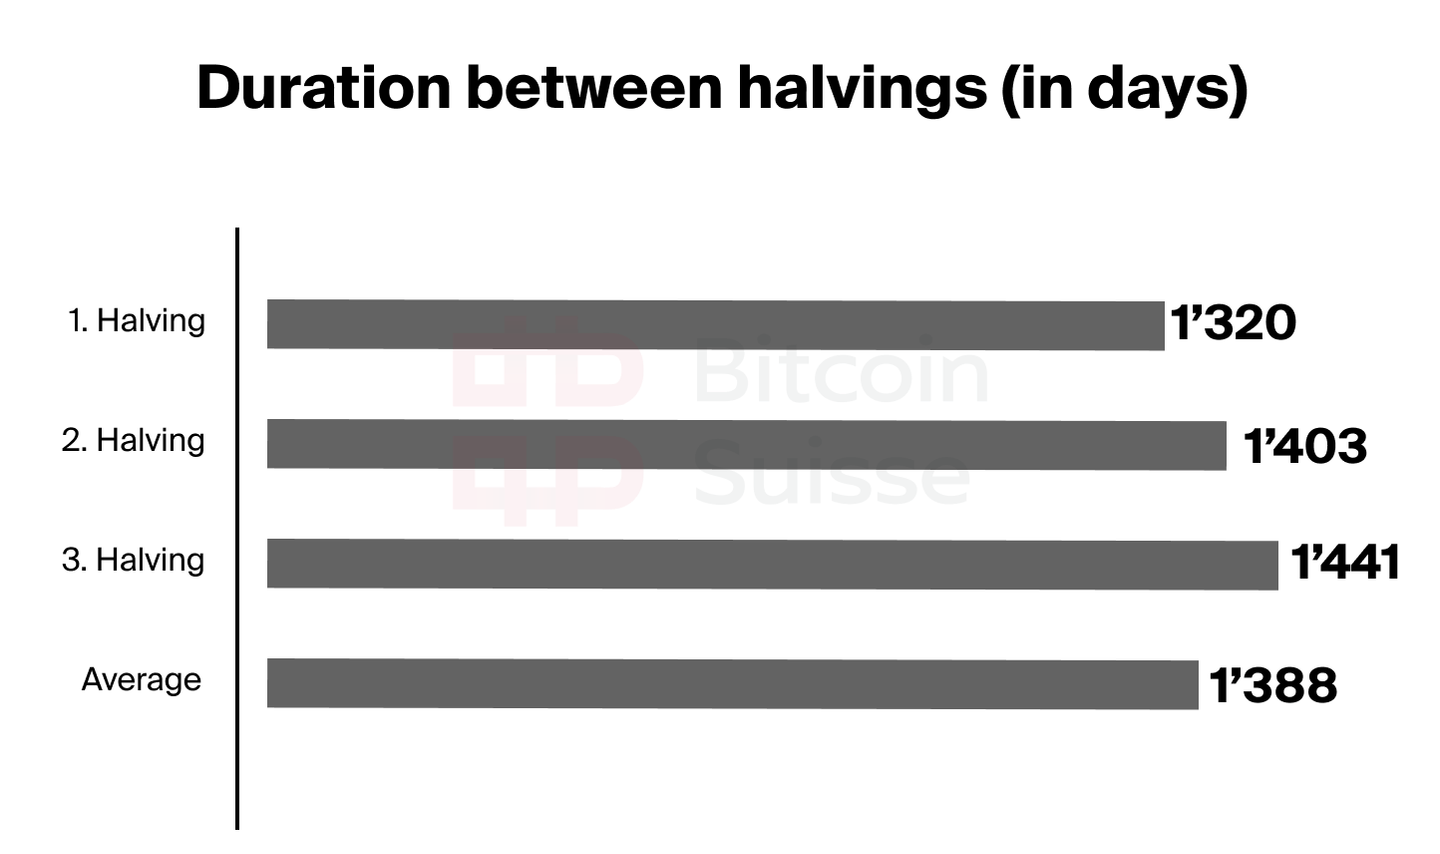
In the chart below, we can see the duration between the past halvings in days. The second halving took place 1’320 days after the first, the third halving 1’403 days after the second and the upcoming fourth halving is projected to take place 1’441 days after the third halving, which leaves us with an average of 1’388 days between the halvings.