
Denis Oevermann
Investment Analyst / Crypto Researcher
Crypto & Macro - Is the Bottom in? Version 4.0
Aug 9, 2023 - 10 min read

Executive Summary
- Our novel Total Crypto Market Cap Risk Metric indicates that the price levels observed for the total crypto market during this bear market are near the bottom.
- The Total Crypto Market Cap Risk Metric in combination with its logarithmic top, bottom and trend regression channels support the bottom theory, while implying that prices are likely to move sideways or around prior lows in the interim.
- Our intra crypto cycle dynamic analysis shows that the current late-stage bear market and early bull market recovery in the future will be primed by altcoin dominance fading away, and BTC and ETH outperforming on a relative basis.
- Dissecting the Big Debt Crisis, we find that the U.S. federal debt has 98-folded in the past 57 years, growing 5.19% p.a., while broad money M2 grew at 6.33% p.a.
- Despite the Big Debt Crisis, the federal debt does not “really matter”, as debt costs are declining on a relative basis through financial repression, with the economic burden being carried by the private sector and savers – giving rise to the beneficial traits of crypto assets.
- The current BTC prices have low risk as implied by our new Bitcoin Price Risk Metric, indicating that, while price declines are possible, the price levels of the current bear market align with the bottom.
Introduction
Since our latest edition of Crypto and Macro the crypto market fluctuated around our predicted model prices, seeing BTC dropping down to $25k, only to recover back well beyond $30k. Also, for the first time a “real” spot BTC ETF in the U.S. appears to be a possibility and might be the catalyst for the next bull run. On the macroeconomic side, inflation has been cooling off and appears to be back under control, while the FED has seemingly reached its terminal rate, at least in the interim, and markets face real rates for the first time in decades. During that same time the debt ceiling and debt burden crisis played out. Given the many bullish and bearish signals, this edition of Crypto & Macro – Is the Bottom in? which is already in Version 4.0, aims to untangle the current dynamics and interconnection between the crypto market and the latest macro-events and macroeconomic data.
In this edition we will unravel and assess the crypto market dynamics and get an overview of the respective market cycles of crypto. Also, we will introduce a novel risk metric for the total crypto market cap in alignment with the overall trend channels for crypto bull and bear markets. Given the many questions surrounding the rising debt burden and most recent “rise”, i.e., suspension, of the debt ceiling, we will take an in-depth look into the Big Debt Crisis and examine its consequences. Lastly, we are introducing our second novel risk metric in this edition, the Bitcoin Price Risk Metric and its implications on the bottom being in. – Let us dive in!
Crypto market dynamics and risk metric
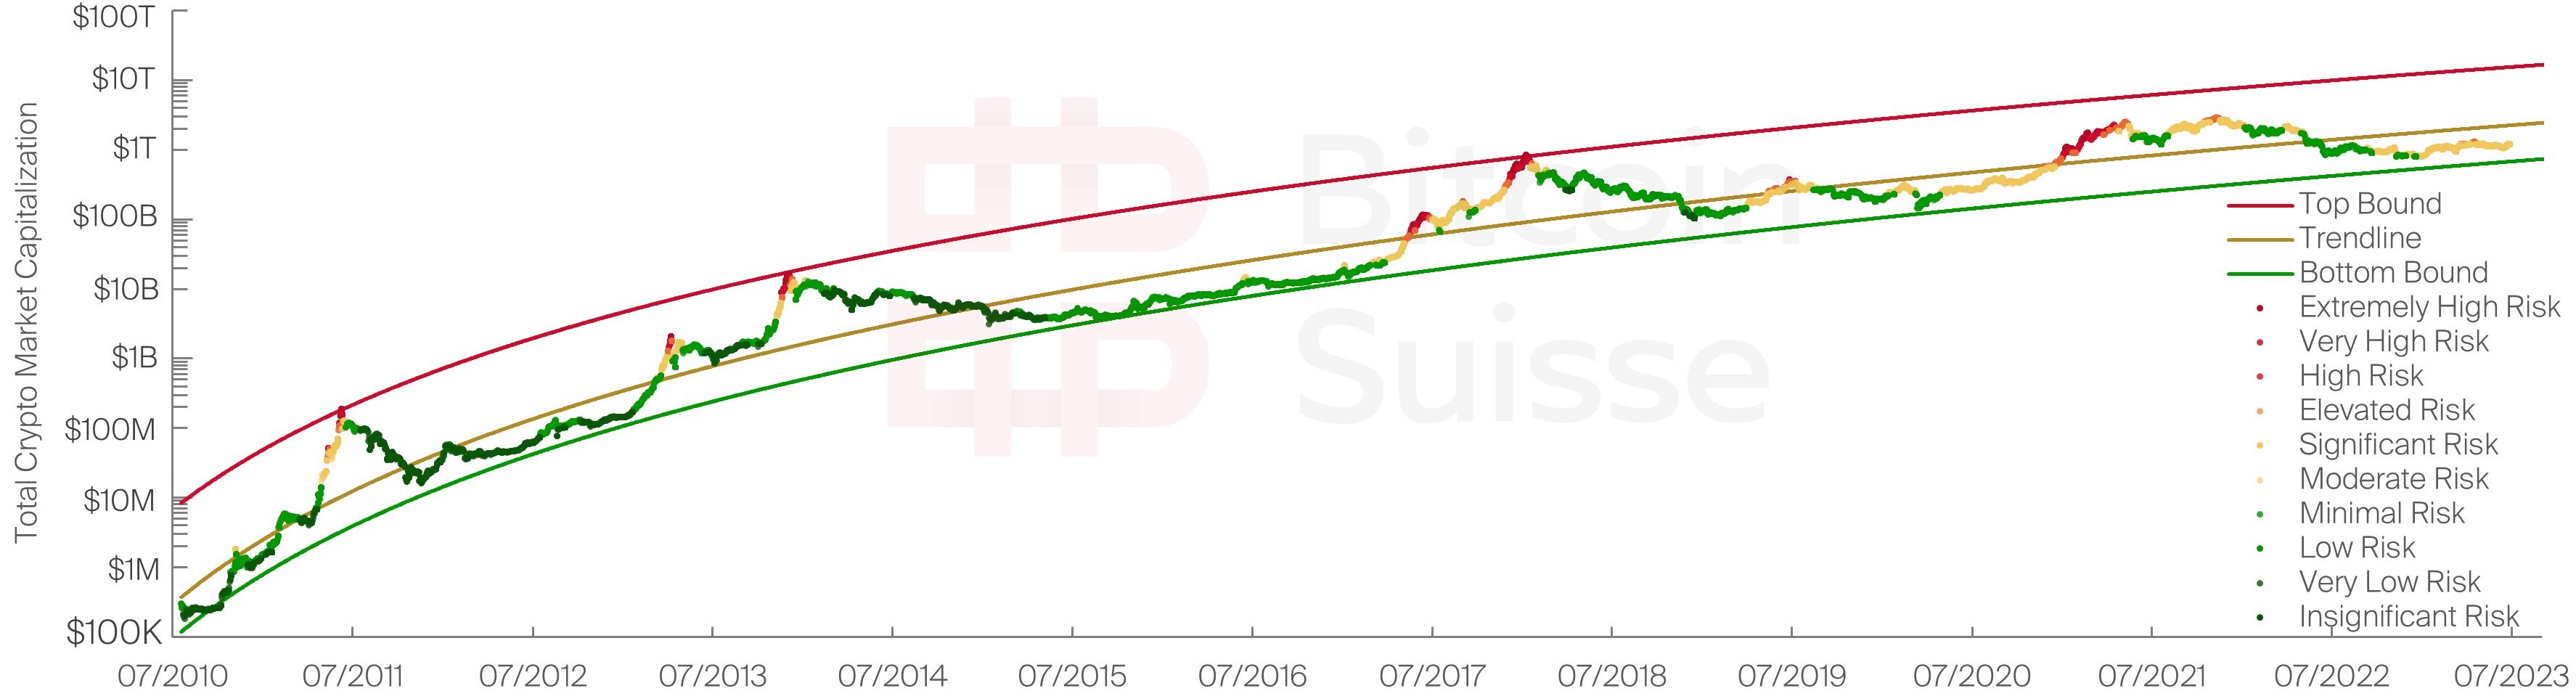
A notable distinction of the crypto market as an asset class is its trait of pronounced cyclicality and seasonal movements. Incorporating this trait allows for the derivation of reoccurring trends and channels of market cycle tops and market cycle bottoms. Displayed in Figure 1 is the total crypto market capitalization of the entirety of crypto assets on a logarithmic scale. The market capitalization is color coded by our Total Crypto Market Risk Metric. It indicates whether the crypto market, based on a specific market cap observation, is classified as high risk or low risk. The risk metric considers factors such as momentum, trend, relative market strength and relative crypto market cycle dynamics.
If prices move up moderately, the risk stays constant, whereas prices moving sideways or declining will reduce the implied risk of the Total Crypto Market Risk Metric. Fit to the total crypto market cap, color-coded by risk, are its logarithmic regression channels for cycle tops and cycle bottoms, as well as the overall total crypto market cap trendline.
We can observe that during each market cycle the crypto market tends to revisit its lower regression bound while spending significant amounts of time there throughout bear markets. Notably, it does not deviate to the lower side of it, but rather climbs up with it over time during weak market phases and late-stage bear market recoveries. Altogether, the risk metric for the entire crypto market performed well, and managed to identify the respective cycle tops, while indicating relatively low risk phases. However, the most effective application of the risk metric is the conjunction of the logarithmic regression trend channels and the implied market cap risk. Especially for the identification of cycle lows and bottoms, market phases below the total trendline, close to the bottom channel, while the risk metric indicates low risk, pointed out the bottom, historically.
During the current bear market, the crypto market converged substantially into the lower channel, while the risk has been low throughout various times, indicating that overall, we are close to the bottom. Considering the dynamic of prior bear markets, the current short-term recovery seems most comparable with the 2019 bear market rally, due to its increased implied risk and fading momentum. This implies that the likelihood of a sustained sideways move around current bear market levels in the interim is most probable.
Overview of the crypto market cycles
On top of the inter cycle dynamics outlined in Chapter 1, there are further notable intra cycle dynamics within the crypto market. Throughout the stretched-out market cycles of bull and bear markets, the constellation of crypto asset dominance fluctuates substantially. Using this fluctuation in relative crypto asset dominance, we can get an overview of the crypto asset class during respective cycles.
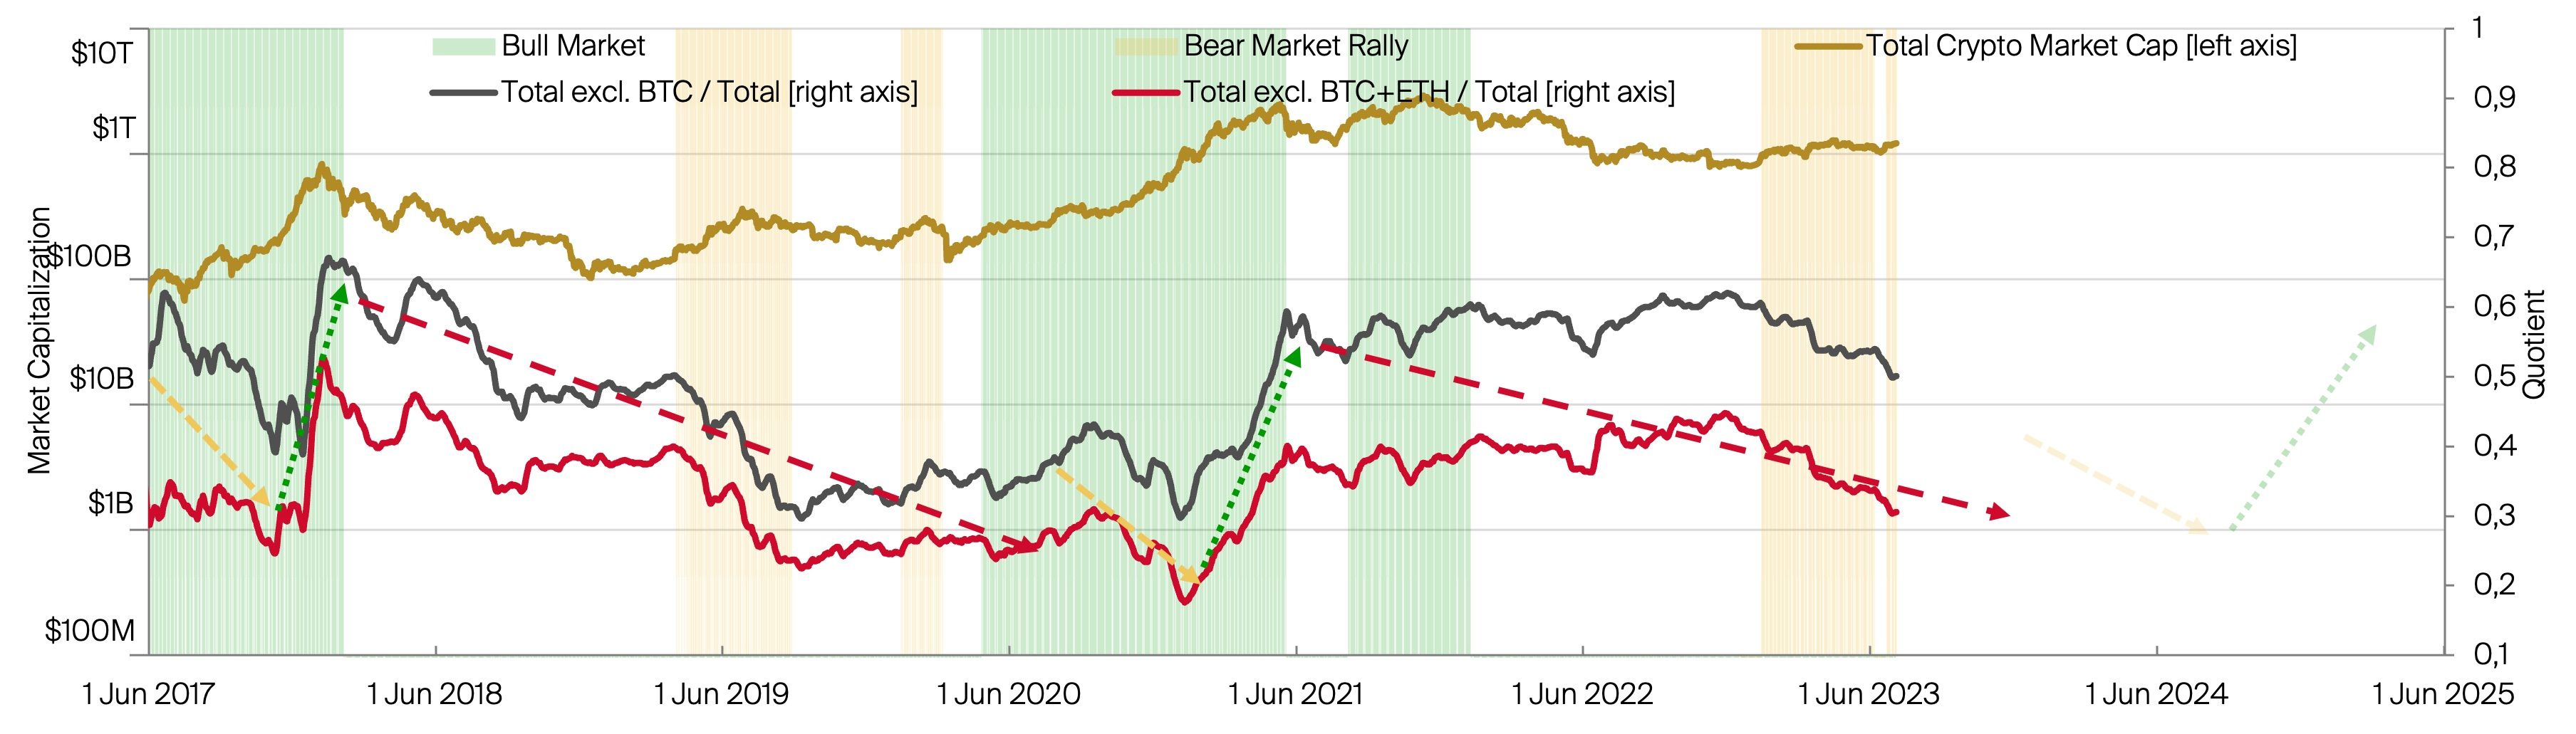
In addition to the total crypto market cap, we display the dominance of the altcoin market in Figure 2. The black line represents the altcoin market dominance excluding BTC and including ETH (black line) and the altcoin market excluding BTC and ETH (red line). Overlayed are the bull market (green) and bear market rally (yellow) phases, with a bear market rally being defined as a bull market occurring during a bear market phase.
Overall, the crypto market behaves in the following three-part dynamic. During the early stages of a bull market (yellow arrow), BTC tends to lead the rally, ETH to a lesser extent, causing the dominance of the altcoin market to drop substantially. Throughout the final phase of the bull market (green arrow), including the typical “bubble” top, altcoins typically outperform BTC and ETH significantly, causing the altcoin dominance to rise rapidly. Following the crypto market cycle top, and entering the prolonged bear market phase (red arrow), altcoins underperform compared to BTC and ETH. This implies that even though all crypto assets are losing in value, altcoins witness higher price drops, and lose on their respective BTC and ETH trading pair.
At present, the crypto market is in its late bear market stage which is pronounced by the continuous underperformance of altcoins compared to BTC and ETH, and expected to last throughout the following month (indicated by the projected yellow arrow). The mechanism that causes this is altcoins losing more in price during market drops than BTC and ETH, whereas altcoins fail to keep pace amidst bear market rallies and recoveries, which are led by BTC and ETH.
The major explanatory factors and variables that are responsible for the current dynamic are a general flight to safety over the course of weak market phases, while major liquidity flows in and out of the crypto market through BTC (and ETH to a lesser extent). Synonymous with prior late-stage bear markets and early bull market recoveries, we expect the dominance of the altcoin market to further fade in the coming months, with BTC and ETH outperforming, on a relative basis.
Big Debt Crisis
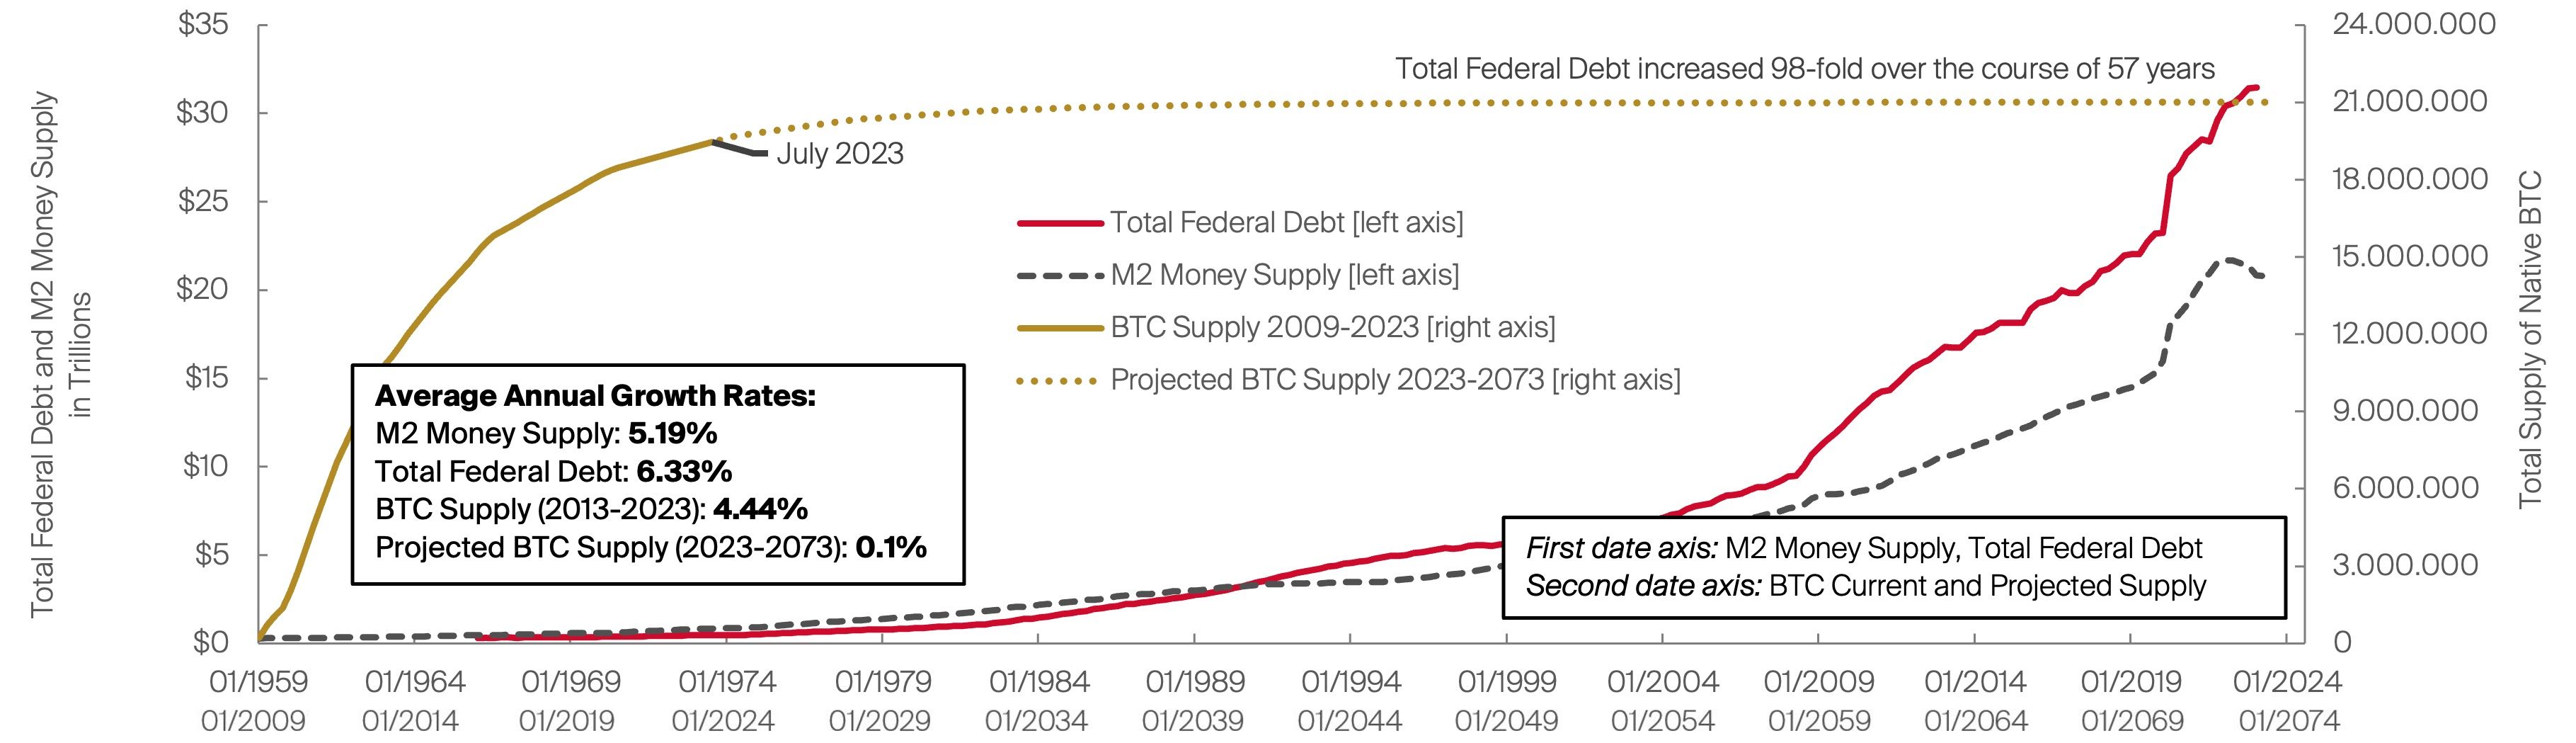
Despite the crypto market being cyclical and quite predictable in the long run, also with the help of our models, certain macroeconomic components must not be overlooked. Even though the crypto market is generally less impacted by macro factors than equities and traditional assets are, the current extent of the “Big Debt Crisis” requires further inspection. Over the course of less than 60 years, the total federal U.S. debt multiplied almost a hundredfold, as displayed in Figure 3. Accompanying this process, the debt ceiling has been raised more than once annually on average, from $5.7 billion to $31 trillion from 1917 until today, for a total increase of a staggering 5439x.
Almost in lockstep with federal debt, the M2 broad money supply has been increasing. Annualizing the growth rates, total federal debt grew at 6.33% p.a., M2 at 5.19% p.a. For reference, the monetary supply dynamics of Bitcoin are added to the chart, and forward projected to the same timeframe, showcasing that they are progressing exactly converse.
The issue at hand is not the alarming amount of debt per se (being ~30 times the entire crypto market), however, but rather the vicious, reinforcing cycle of financial repression that it starts. In the process of managing federal debt, money gets printed, expanding liquidity and subsequently causing inflation, which will hamper investments and economic growth. Readers of our last Crypto & Macro Version 3.0 will recall how traditional assets do not significantly outperform this process, nor global liquidity.
One might ask what the benefit of this mechanism is, and whom the subsequently caused inflation aids. Inflation primarily improves debt and budget balances of governments, while shifting its economic costs towards the economy and private economic actors (households). Spiking inflation (through the process described above) has a direct reductive effect on debt balances and debt ratios. A 1 percentage point increase in inflation is reducing the federal debt burden by 0.6 percentage points relative to GDP. Putting this in layman ́s terms: in return for the economy suffering a 1%pt. “loss” across the board, the government is recuperating 0.6%pt. on its currently outstanding debt. The largest share of this “cost” is borne by cash and bondholders, thus savers.
Does all that debt even matter?
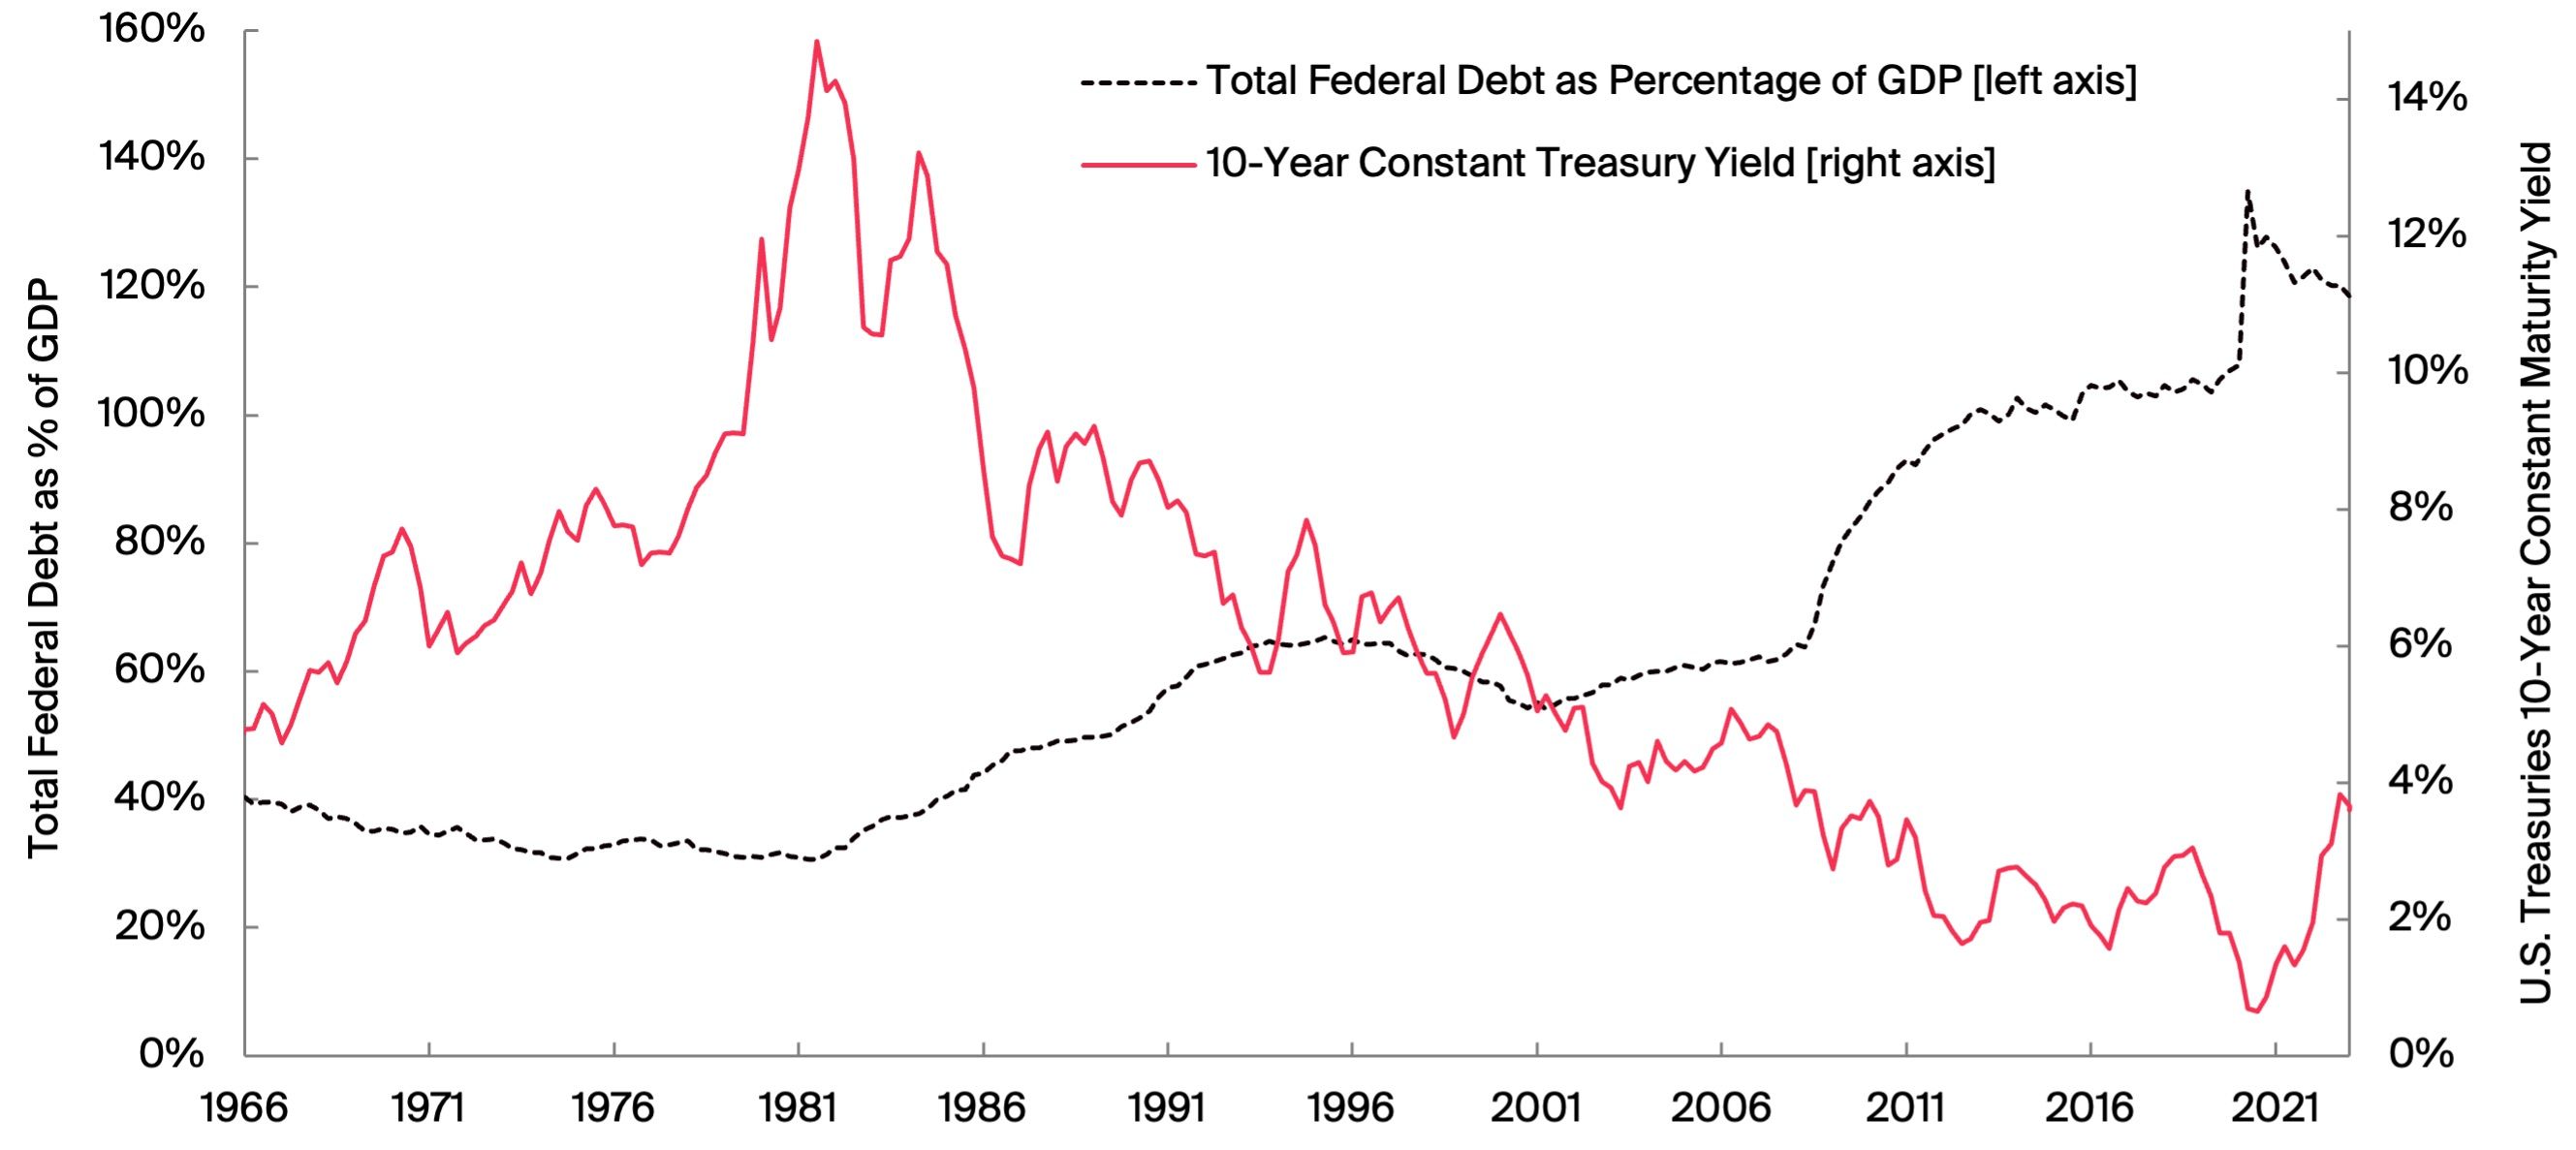
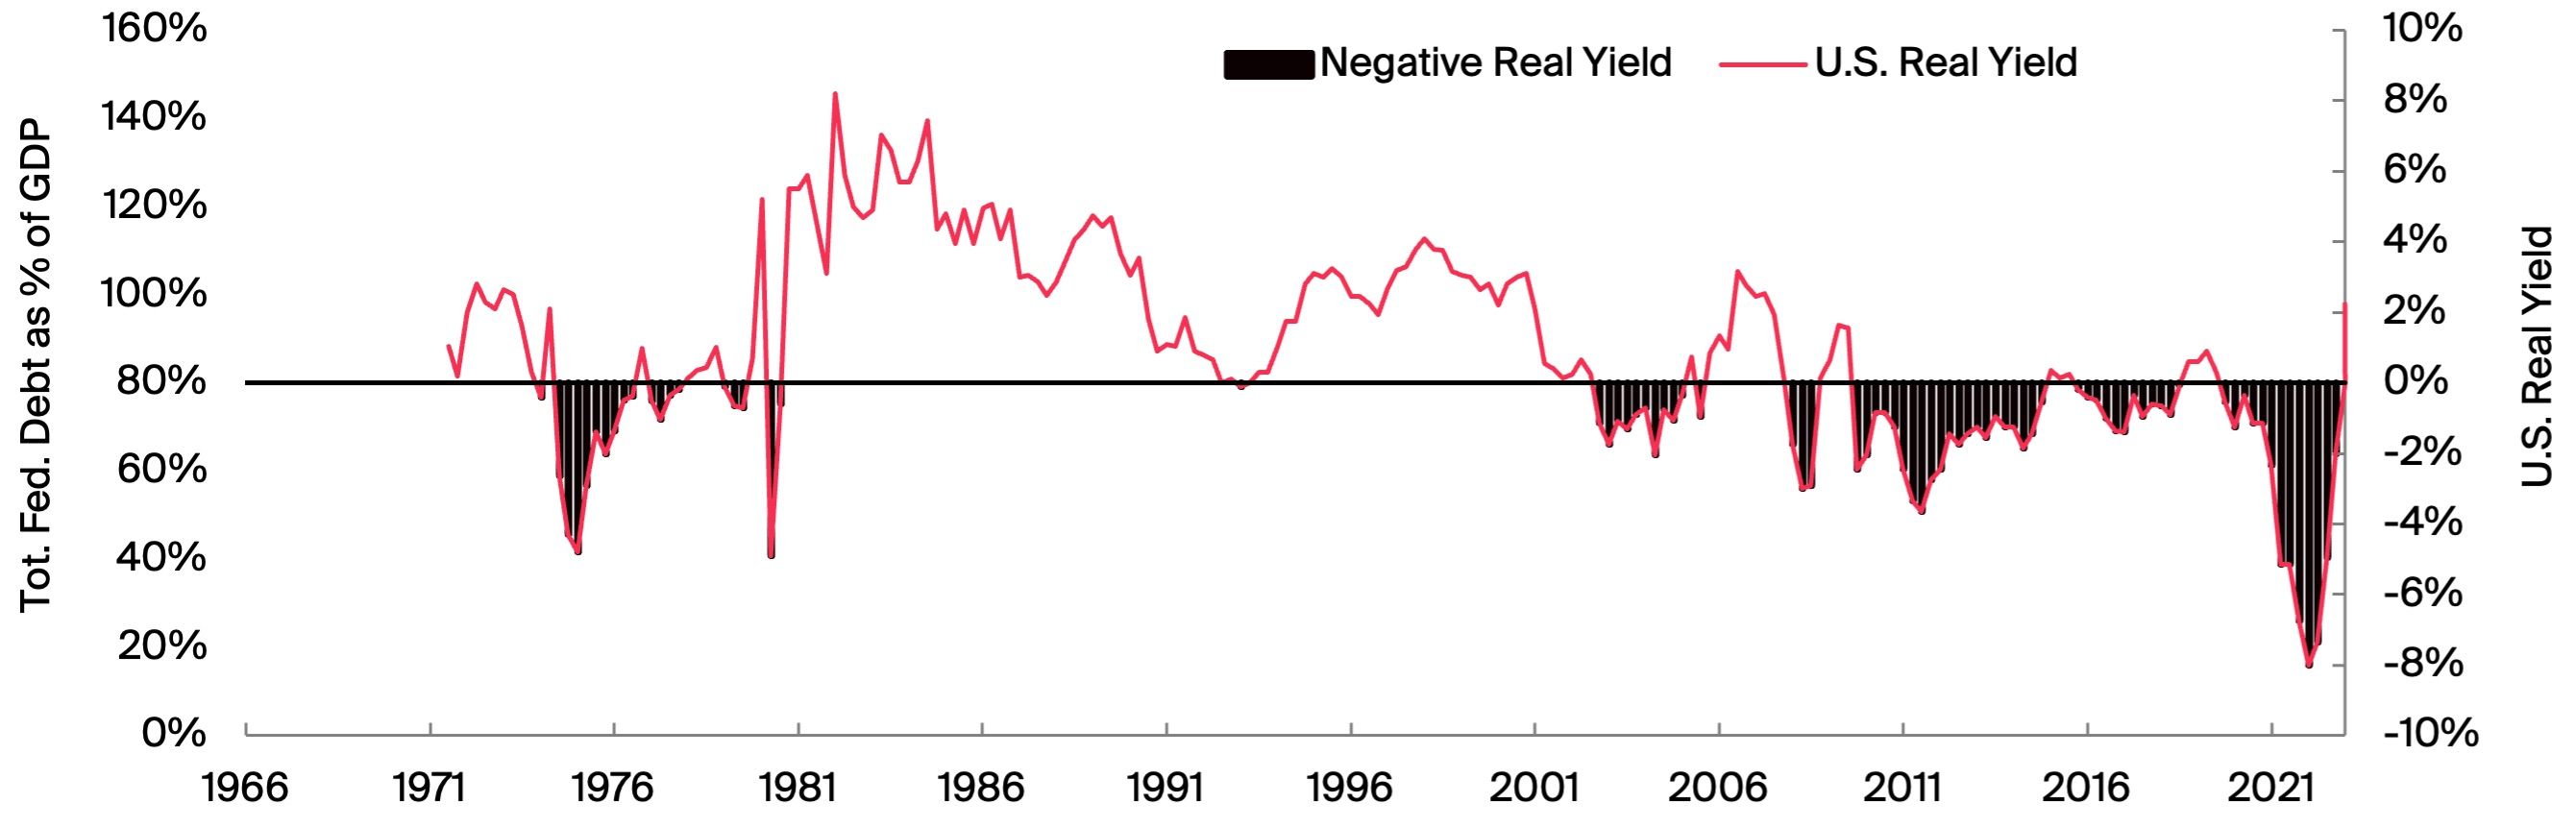
Though the economic cost of the Big Debt Crisis that economic actors have to bear is very real, the question arises whether the ever-rising amount of debt even matters in reality? Charted in Figure 4 is the U.S.’ total federal debt as a percentage of its GDP and the 10-year constant treasury yield, which can be broadly thought of as the corresponding cost for the federal debt. While the relative debt burden increased substantially over time, the 10-year yield declined perpendicularly. This is one of the major factors that offsets the relative debt burden and its cost.
Consequently, and simultaneously, through inflation being sustainably elevated in the background, real yields have been near zero and even negative for a considerable part of the same period (white bars in the lower chart area). Overall, real yields have been negative 25% of the total time, negative two thirds of the time since 2000 (64%) and negative even 80% of the time since 2009 (Kudos to Bitcoin ́s inception).
The resulting and ongoing financial repression of negative real rates amidst inflation is lowering the federal debt/GDP ratio even further. On the other end of the spectrum, economic progress and growth is doing its part of keeping the federal debt/ GDP ratio at bay.
Does all that debt even matter?
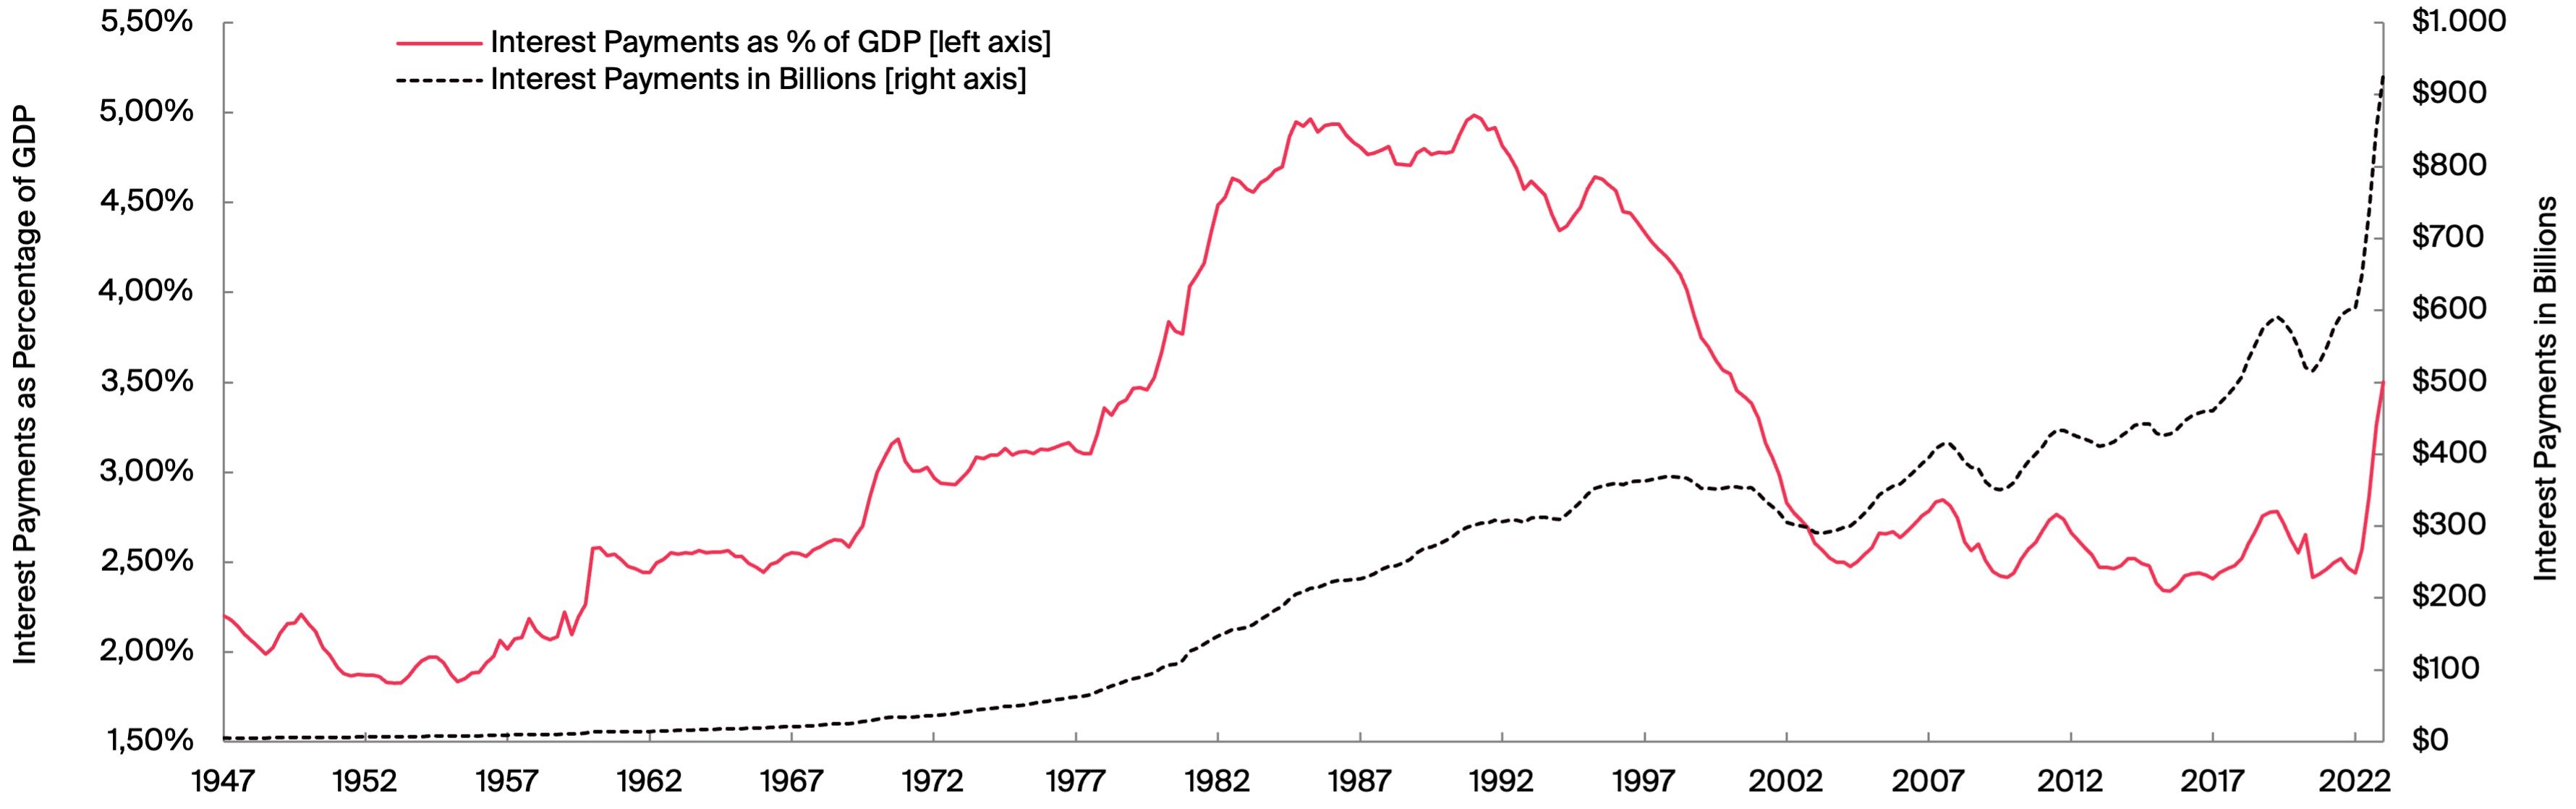
Regardless of the mechanism surrounding Figure 4, the impact of the debt burden is increasing nevertheless, as displayed in Figure 5. Even though the total interest payments in absolute terms have been rising consistently since the second half of the last century, the actual share of interest payments as a percentage of GDP has been offset mostly due to declining yields. Nonetheless, due to the current regime of interest rate hikes, to keep inflation under control, the relative share of interest payments saw the steepest incline since the 60s.
Given the recent return to positive real rates to an extent not seen in more than a decade, the outlook on rate cuts could appear optimistic, which would decrease the debt burden to lower levels. Also, there is an impression of “economic pain” within the economy being induced by the high rates and resulting increased cost of debt. However, real rates overall are still relatively low and the impact for economic participants is only materializing to a limited extent. Therefore, the prognosis is for rates to stay elevated for a prolonged period, implying high federal debt costs.
So does the debt matter? The charts and dynamics of the Big Debt Crisis have been presented above, yet the most important factor to answer the question even more coherently is the following. The current and ongoing “cost” of the federal debt is
not directed at eliminating debt, but rather paying off existing and future debt financing costs, with no direct intention of paying back the debt itself at all. Therefore, the relevant question is not whether all the debt matters, but rather whether the ongoing interest payments to finance the already existing, and growing debt level, can be made. There is no significant counterevidence indicating that it cannot be managed. Also, doubling the debt ceiling from hereon will “only” raise it to a 10878 multiple from the initial limit when the debt ceiling was introduced in 1917 – a story to be continued.
Bitcoin Price Risk Metric
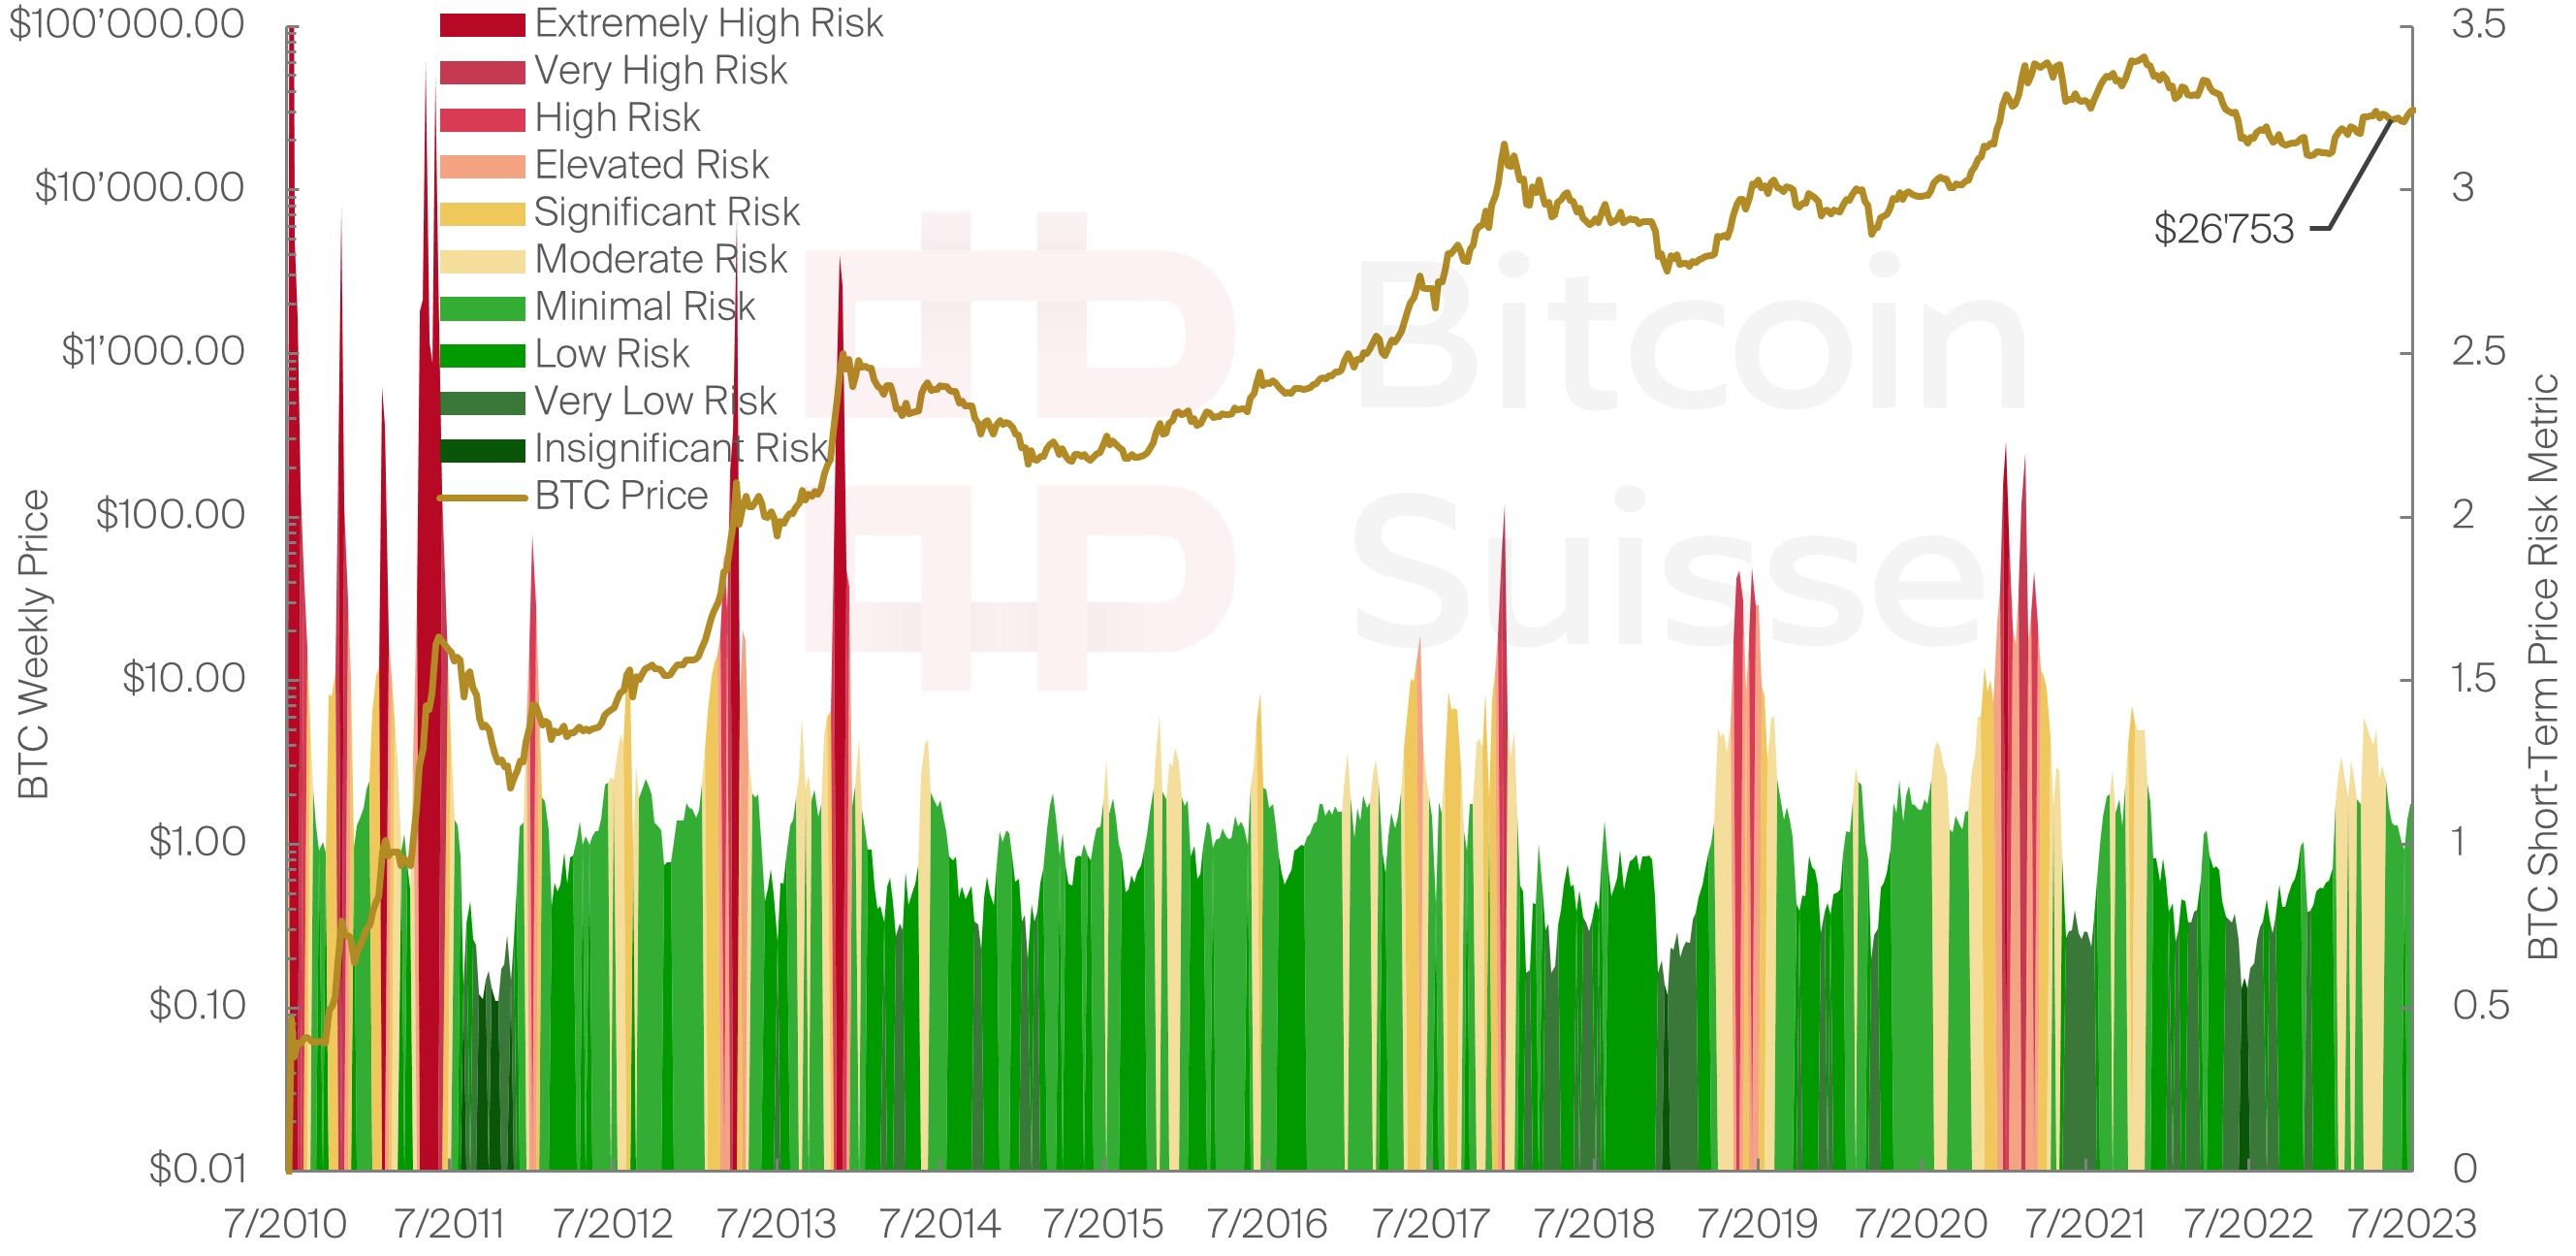
Considering the crypto market cycle dynamics outlined in Chapter 1 and 2, it is crucial to investigate the current price risk of BTC, given its dominant position as the crypto “market mover”. Depicted in Figure 6 is our novel Bitcoin Price Risk Metric, which is derived from various factors such as relative market strength, momentum, and overall trend of BTC ́s price movements. It indicates in a color-coded implementation whether a certain price is generally estimated to be high or low risk. The risk metric will indicate a higher risk if price movements to the upside become unsustainable and a top is likely. Similarly, if prices move sideways or decline for a prolonged period, the implied risk will naturally decline.
We can observe how past cycle tops have been accurately identified as very high and extremely high-risk prices. Conversely, during each bear market BTC ́s price converged back into the very low risk price territory. At current prices BTC is likely within the minimal risk territory, indicating that, given the far progressed stage of the bear market, prices are in what can generally be considered accumulation territory around the bottom. However, the low implied risk by the Bitcoin Price Risk Metric does not indicate prices cannot decline further, it is merely an indication that the downtrend momentum is weak overall.
Final Assessment
Our models and long-term trend analysis indicate that the crypto market is currently in its final stage of the ongoing bear market, which will last for the coming month. Its dynamics are primed by a weak altcoin market, and a strong and growing BTC and ETH dominance, which will increase throughout the transition into the next bull market. Overall, prices are likely to fluctuate around current cycle lows for the foreseeable future.
Despite the economy and especially the labor market remaining strong at present, the Big Debt Crisis we analyzed in depth will be monitored in the future, and in conjunction with the overall recession risk within this business cycle. Though the Big Debt Crisis does not appear to be a real cause for concern any time soon, it is the economic implications and resulting financial repression of an increasingly debt driven, inflationary monetary system that give rise to the truly beneficial traits of crypto assets in the long run.
Our novel risk metrics for both the entire crypto market and BTC indicate, in combination with their respective long-term trends and the progressed bear market, that the bottom prices have been seen for the current bear market cycle, implying fluctuations around prior price levels in the near term.
Table of Figures
- Figure 1: (Chart) Bitcoin Suisse (Data) CoinMarketCap
- Figure 2: (Chart) Bitcoin Suisse (Data) CoinMarketCap, BTC Index, ETH Index – TradingView
- Figure 3: (Chart) Bitcoin Suisse (Data) Federal Reserve Bank of St. Louis, Federal Reserve, Blockchain.com
- Figure 4: (Chart) Bitcoin Suisse (Data) Federal Reserve Bank of St. Louis, Federal Reserve – TradingView
- Figure 5: (Chart) Bitcoin Suisse (Data) Federal Reserve Bank of St. Louis
- Figure 6: (Chart) Bitcoin Suisse (Data) BTC Index – TradingView
Denis Oevermann
Investment Analyst / Crypto Researcher