
Denis Oevermann
Investment Analyst / Crypto Researcher
Crypto & Macro - Is the Bottom in? Version 5.0
Oct 1, 2023 - 10 min read
Should we be scared? Against all odds, and despite the ‘second scare’ probably materializing around Q1/Q2 2024, it is what happens once the ‘second scare’ unfolds that is of concern. As soon as the system and the economy show sufficient cracks and the ‘second scare’ materializes, will most likely coincide with the point in time where monetary and liquidity conditions are being eased again. And crypto will likely lead the way of recovery.
Denis Oevermann, Investment Analyst and Crypto Researcher
Executive Summary
→ We are currently in the second, late stage of the crypto bear market which will likely last until Q1/Q2 2024.
→ The downtrend in crypto and especially altcoin markets could potentially remain for another 6-12 months, while altcoins are likely to make new cycle lows, both against BTC and fiat – ETH has a chance of making a new cycle low, whereas BTC has probably traded around its bottom price.
→ Crypto and equity markets trade at “historical best-case valuations” for bear markets and front run Liquidity Conditions – it is probable that they reverse to the downside in the short- to mid-term.
→ Monetary Conditions are still tightened and an “Uninversion” of the yield curve around Q1/Q2 2024 will likely introduce a recession/economic turmoil.
→ Our 3x3 indicators on Sentiment, Financial Conditions and Economic Activity show confluence towards economic repercussions, and a “second scare” in most asset markets around Q1/Q2 2024.
→ Overall, we find ourselves in a risk-off, high-yield, low liquidity environment, which will last until the system shows sufficient cracks to justify monetary and liquidity easing.
→ The next crypto bull run will likely start at the end of 2024, with the market cycle top occurring in 2025.
→ Crypto is a function of excess liquidity, so once the “second scare” plays out, easing liquidity and monetary conditions could enable it to be among the first assets to bottom.
Introduction
Late-stage bear markets: they are primed by sentiment drying out, volumes fading and apathy setting in amongst market participants, while relative altcoin strength fades into the depth of the bear market. Our first four “Is the bottom in?” editions outlined and showcased how these phases offer generally attractive long-term entry prices for crypto assets, based on price models, risk metrics and cycle dynamics. Despite the good chance that we are close to the bottom, the big picture and external factors skew and amplify market dynamics, nevertheless.
Therefore, our goal for the fifth edition of “Is the Bottom in?” will be to give an outlook for the next 12-24 months on crypto & macro and the likely path ahead of us, based on facts and evidence based quantitative analysis. Hence, we will take a fully comprehensive deep-dive in the macro factors that will impact both crypto and equity markets in the short- to mid-term, such as Monetary and Liquidity Conditions, as well as our 3x3 indicators on Sentiment, Financial Conditions and Economic Activity. On the crypto side, we will investigate crypto market cycles and dynamics again in closer detail. Lastly, we will dissect the actual dynamics that amplify these crypto market cycle dynamics and derive the case why there is light at the end of the tunnel for crypto, and it might in fact be the first asset class to bottom and recover.
Overall, despite being in the final phase of the bear market, there appears to be the risk of a “second scare” in markets ahead of us, so let us take a closer look at what the future (presumably) has in play for us. – Let us dive in!
Crypto Market Cycles
The crypto market progresses in reoccurring phases, similar to the long-term and short- term business cycles we can observe in the economy. Though crypto markets are impacted by macro factors, the underlying cycle dynamics still progress largely independent of external factors. This allows for likely predictions of future cycle phases and their development within a certain confidence level. At present, we find ourselves in the late stage of the current bear market, which is primed by apathy setting in, while interest and engagement fade further. This is reflected not only by historically low volatility levels and market participants leaving or standing by, but also volumes declining and plummeting into the depth of the bear market. At large, it seems that the crypto market is waiting for a “full reset” of the current cycle phase before a new bull run will start in the future. This full reset is characterized by dropping sentiment and a potential final capitulation. Given the external macro factors, (explained in the following chapters and the “the second scare” case study) which have a high likelihood of amplifying this crypto bear market, it is probable to trend sideways, with more potential on the downside, around this cycle ́s lows. Past dynamics and progressions imply that a new bull market is unlikely to start prior to the second half of 2024, whereas the next cycle top is likely to occur in 2025. Nevertheless, prices in crypto markets will recover first, while volumes and engagement only return subsequently, implying that the best long-term entry into crypto assets is around phases of apathy and sentiment being at its lows.
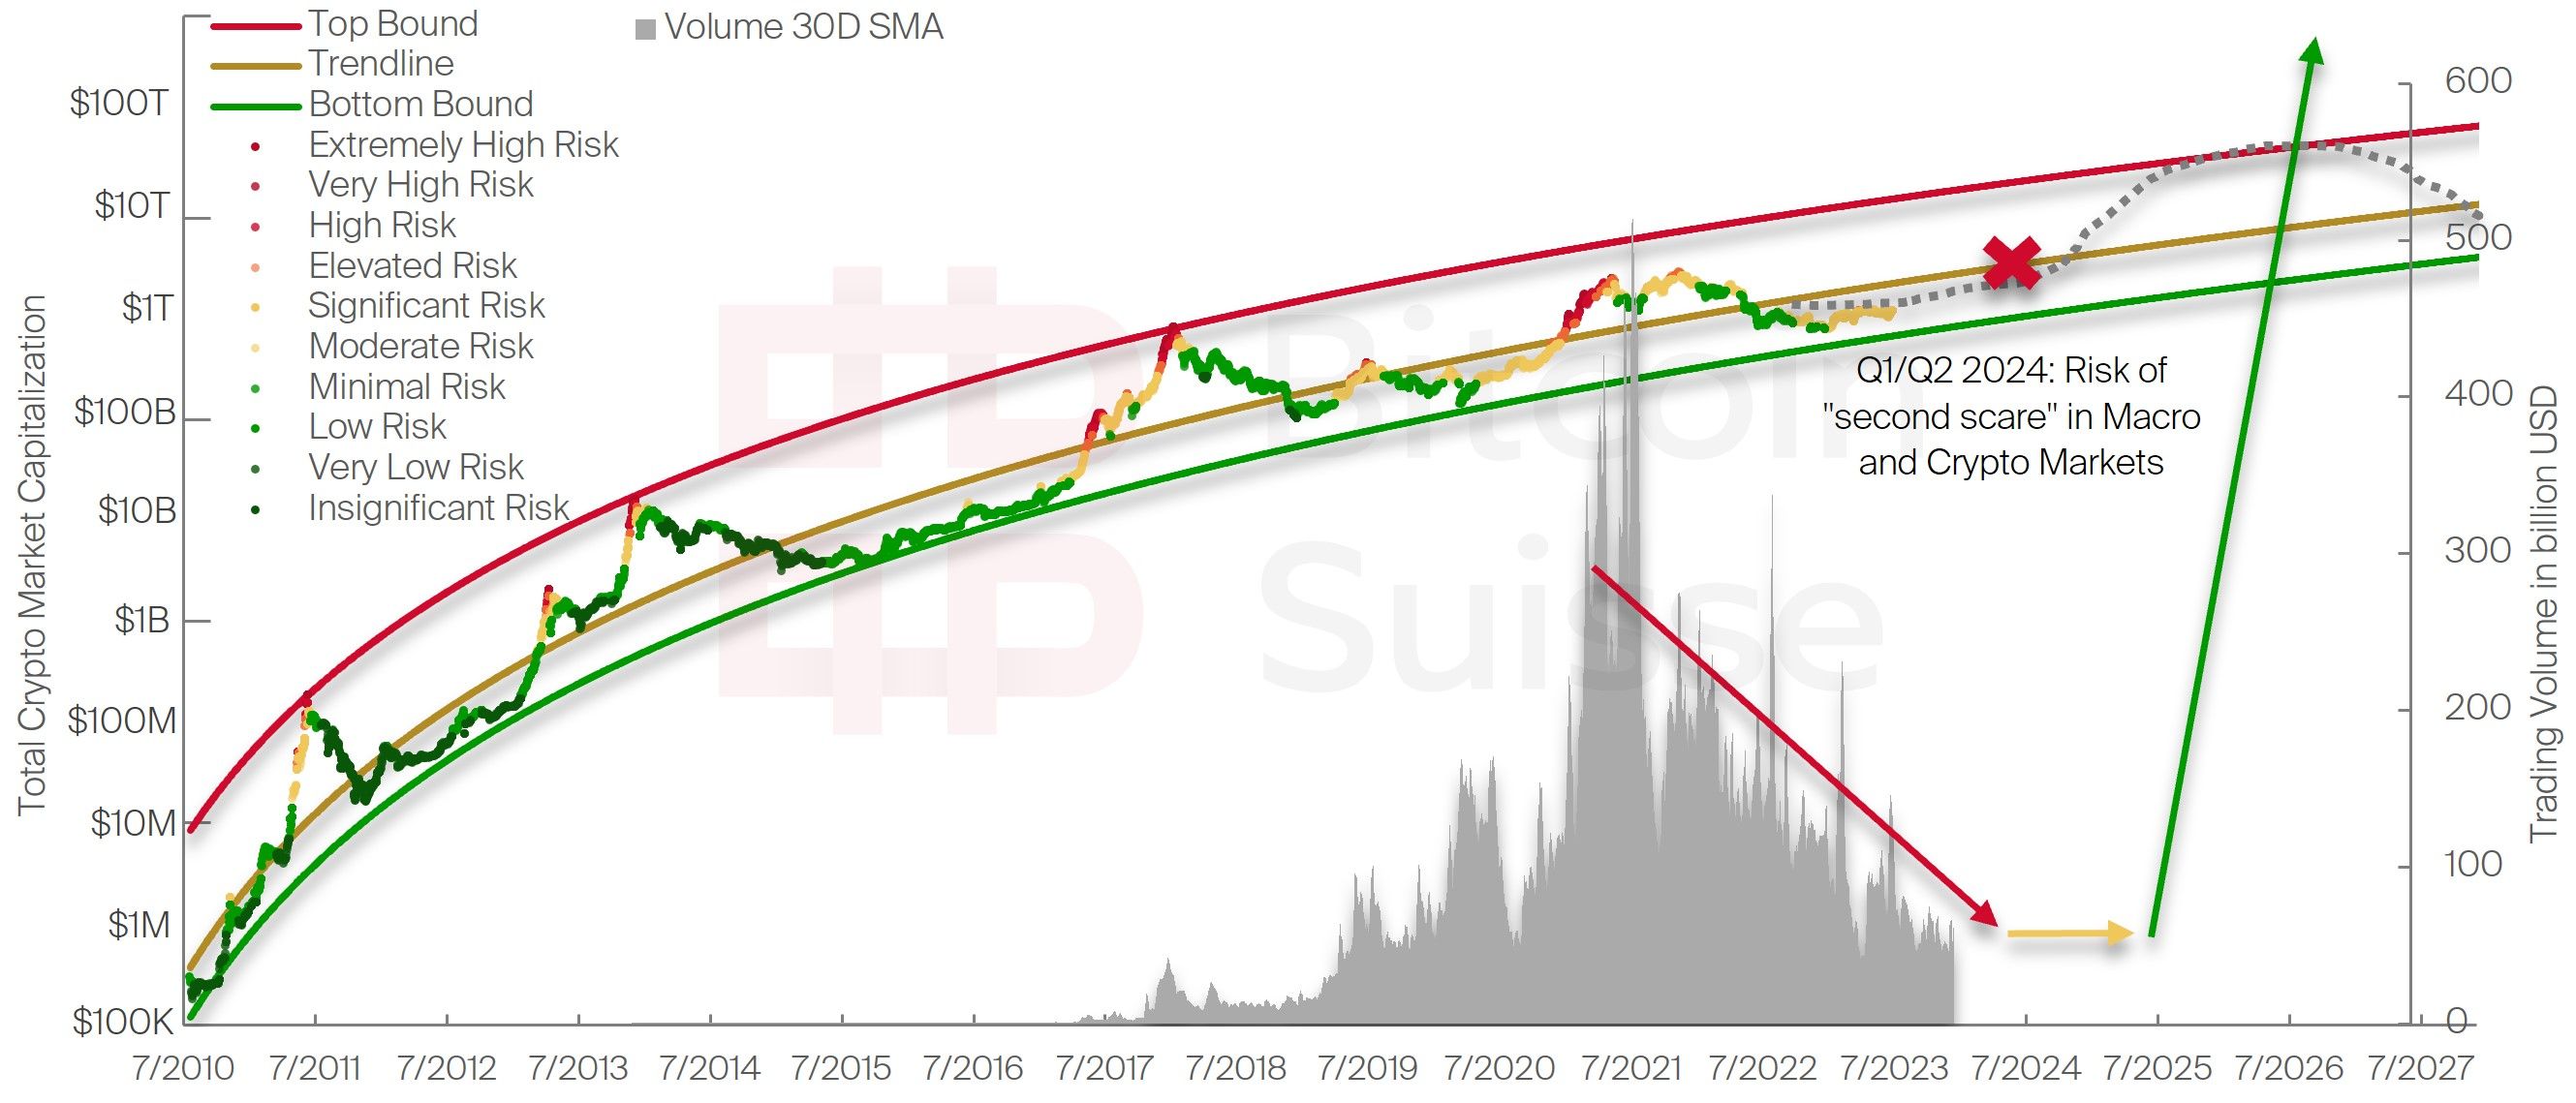
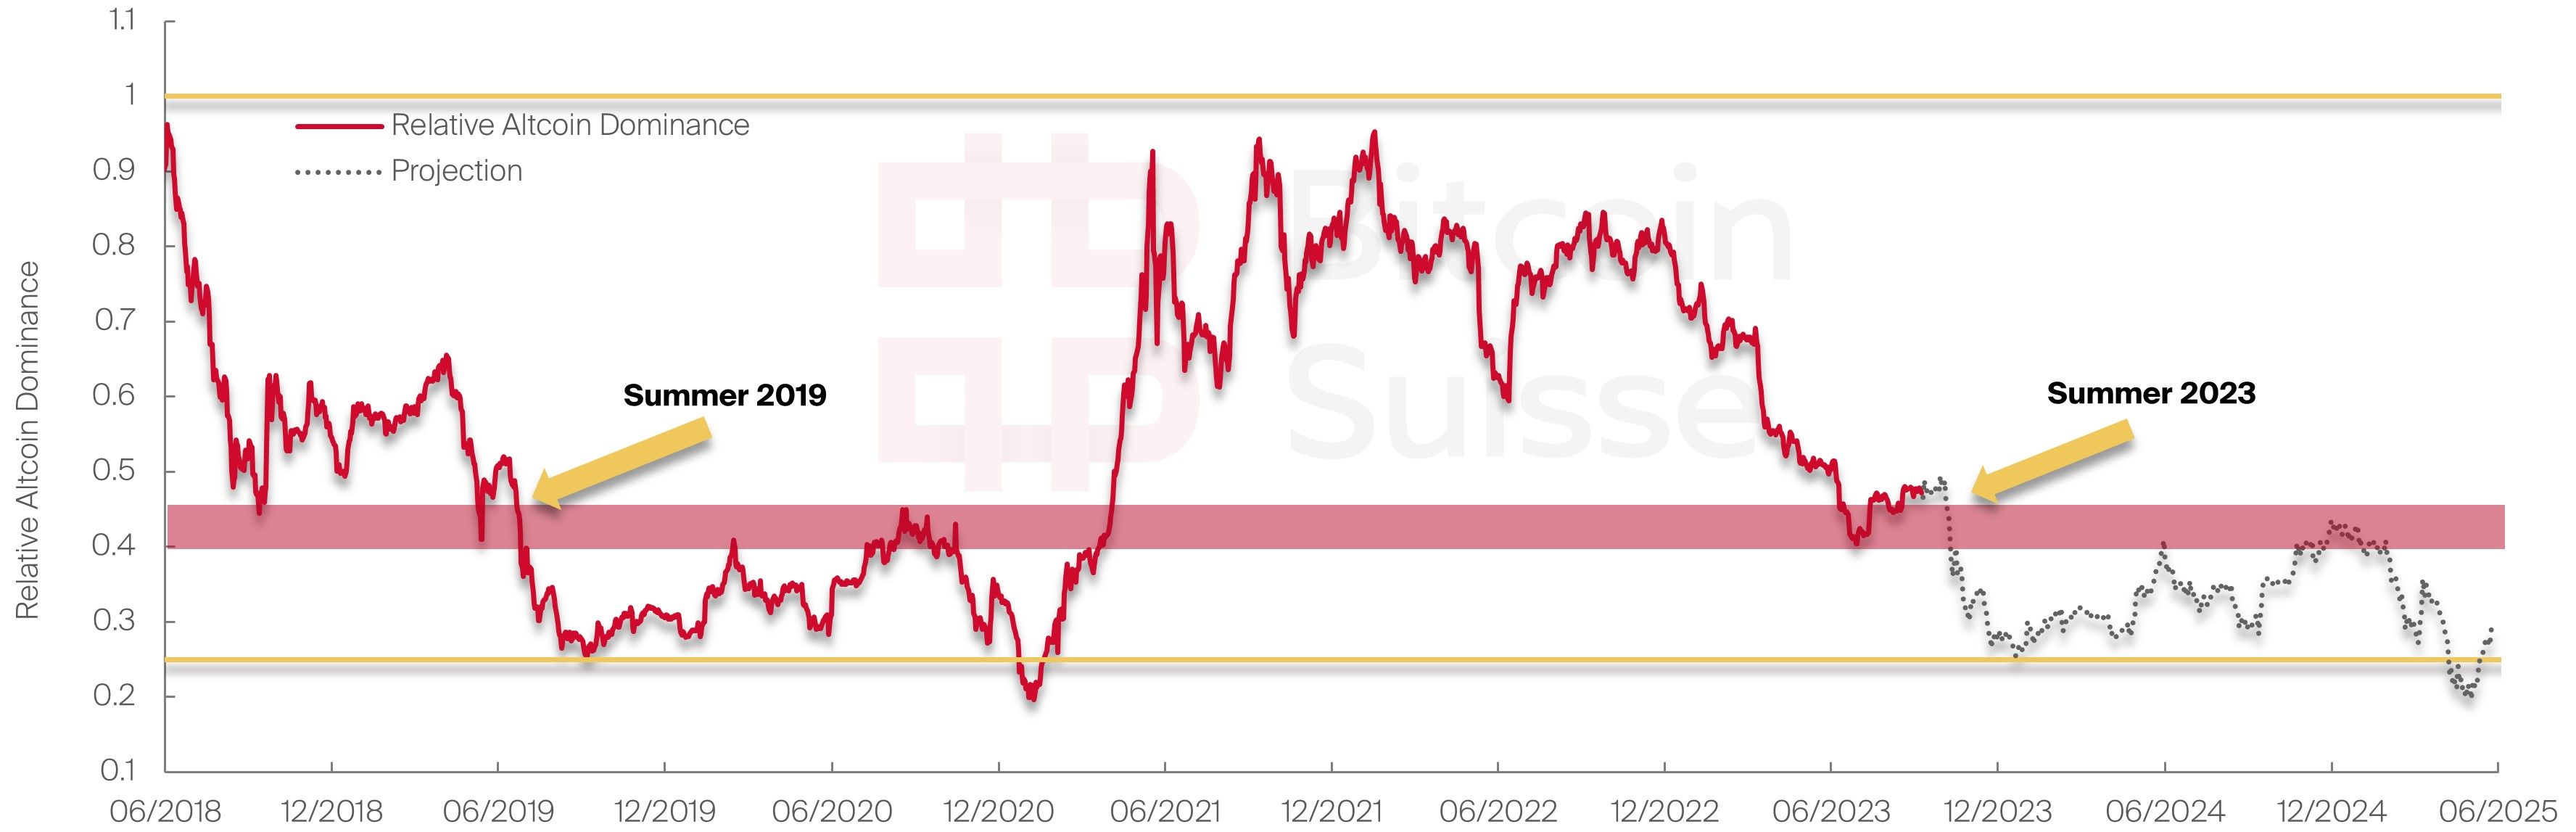
The final phase of the bear market, and the potential of revisiting the lows also has repercussions on the relative strength, constellation, and dominance within the crypto asset class. While it is plausible that the final phase of the bear market will have BTC revisit its lows, it is highly probably that altcoins will make new lows, both in BTC denomination and fiat denomination. BTC is most likely to have traded around this cycle ́s bottom prices but might reverse towards them. On the other hand, ETH, though being tremendously more robust than any altcoin, still has a non-negligible probability of not only revisiting its cycle low, but potentially going lower, based on its long-term trends and cycle dynamics. Also, its dominance and relative strength against BTC will likely further fade throughout the final stage of the bear market, as in prior bear markets.
Given the current risk-off sentiment, and pre-halving year/late-stage bear market dynamics we observe every cycle, the path for altcoins going forward is to lose their significance, with the majority trading at lower valuations than observed throughout this bear market. Overall, the current phase of the bear market can be framed as “Bitcoin Season”, which will transition into “Altcoin Season” at its final stage, which might begin around 2024/2025.
The liquidity jaw
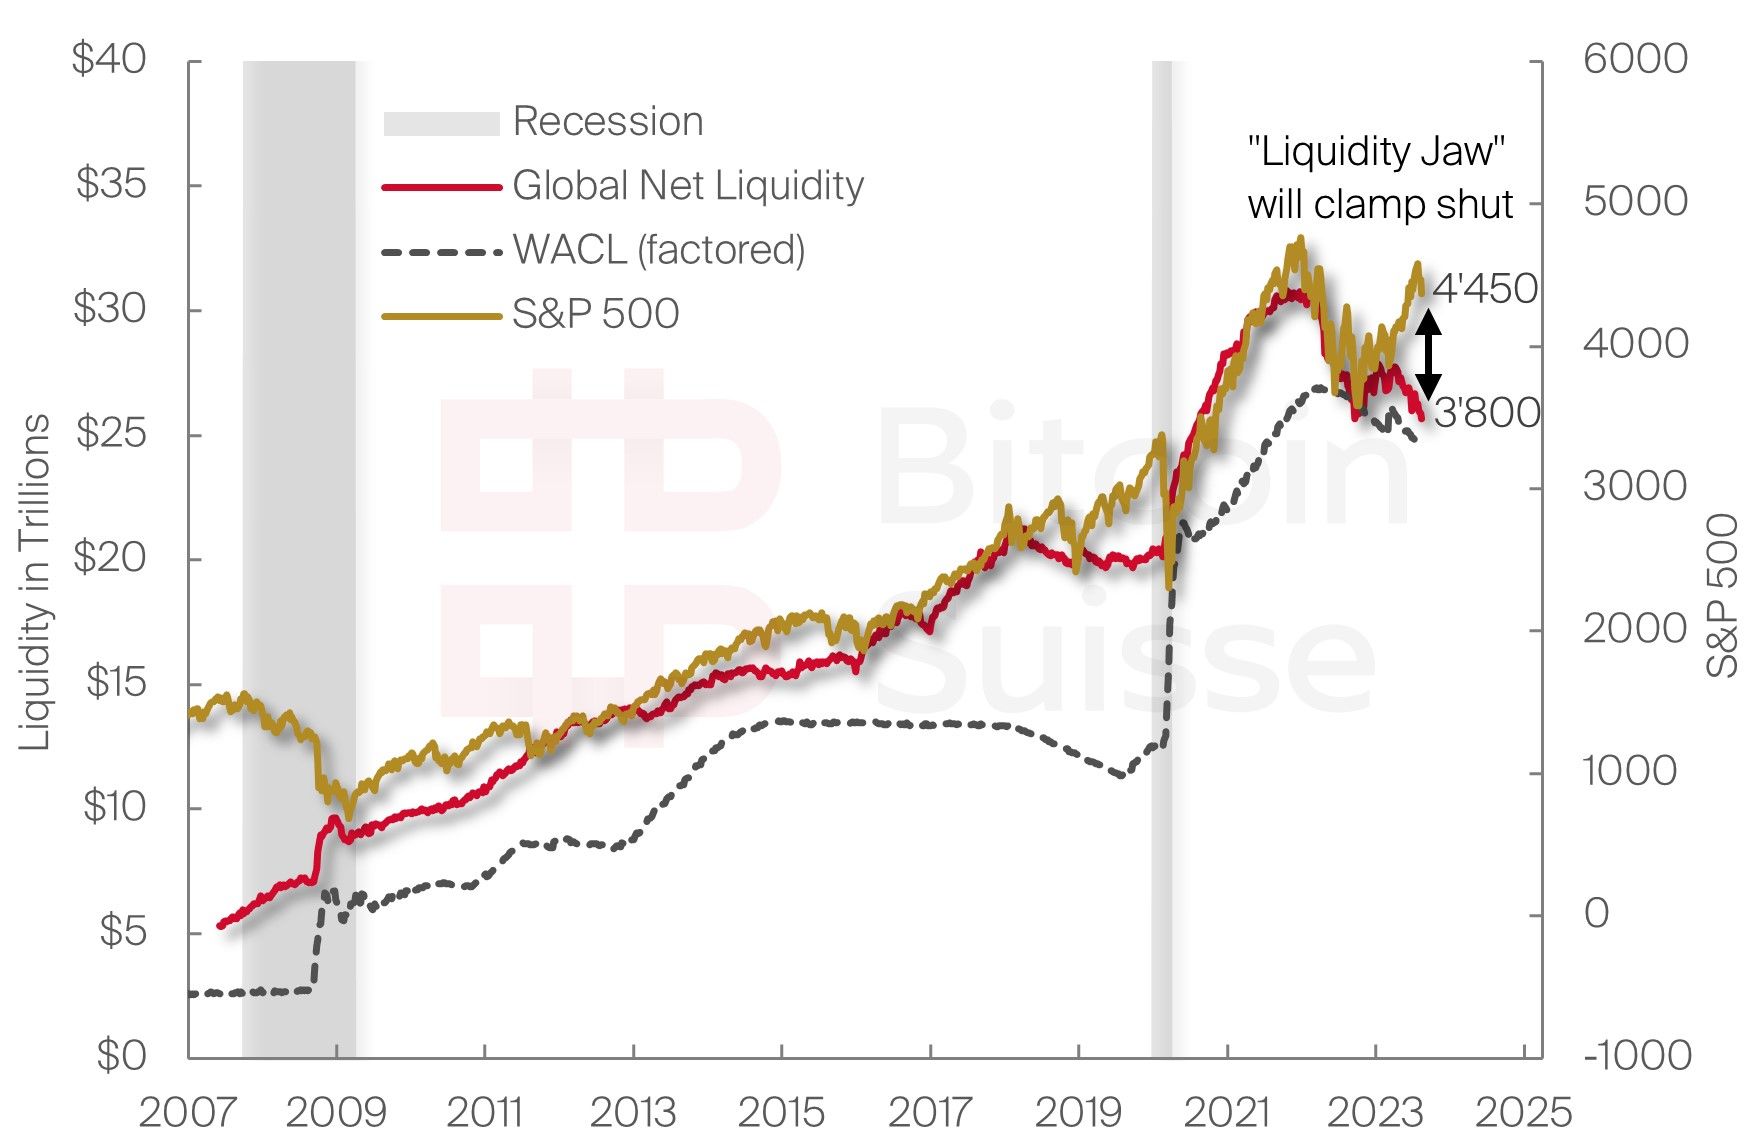
As we outlined in The Case for Crypto 2.0, in our third version of “Is the bottom in?”, liquidity is a major driver of asset performance and is a compensation for “currency debasement” at large. A closer look at Global Net Liquidity therefore reveals insights into likely short- to mid-term price trends of equities and crypto assets.
Global Net Liquidity is the broad money expansion and entirety of global central banks´ asset purchases and balance sheet expansions. Contractions in Global Net Liquidity coincide with economic downturns, while liquidity expansions fuel general economic growth and uptrends in asset prices. Given the close connection of asset returns, following the expansion in liquidity, a disconnect between the two can be, and has always been, only temporary. Currently, markets front run Global Net Liquidity substantially, creating a large gap between liquidity induced price levels and current price levels. This gap, between liquidity and asset prices, due to its appearance also called “liquidity jaw”, will close, as said market inefficiencies can only remain in the interim. Given the current macroeconomic environment, there is a clear intent of keeping liquidity contracting in the short-term, without any present catalyst that would justify a reversal of the tightening cycle. Reintroducing liquidity injections would only occur following a serious economic downturn, which is most likely still further out. Therefore, the only path for closing the liquidity jaw is for asset prices to correct downwards and converge with Global Net Liquidity induced price levels. Overall, the most likely scenario is that asset and crypto prices will witness a trend reversal in the near future, in line with liquidity induced price levels, which are currently around this cycle´s low. The Global Net Liquidity induced price levels are around 3´800 for the S&P 500, and $19´500 for BTC. The cycle lows for the S&P 500 have been around $3´600, and $16´000 for BTC. Less liquid crypto assets, and altcoins will most probably create new cycle lows, if BTC revisits its cycle lows.
Monetary Conditions – Waiting for something to break
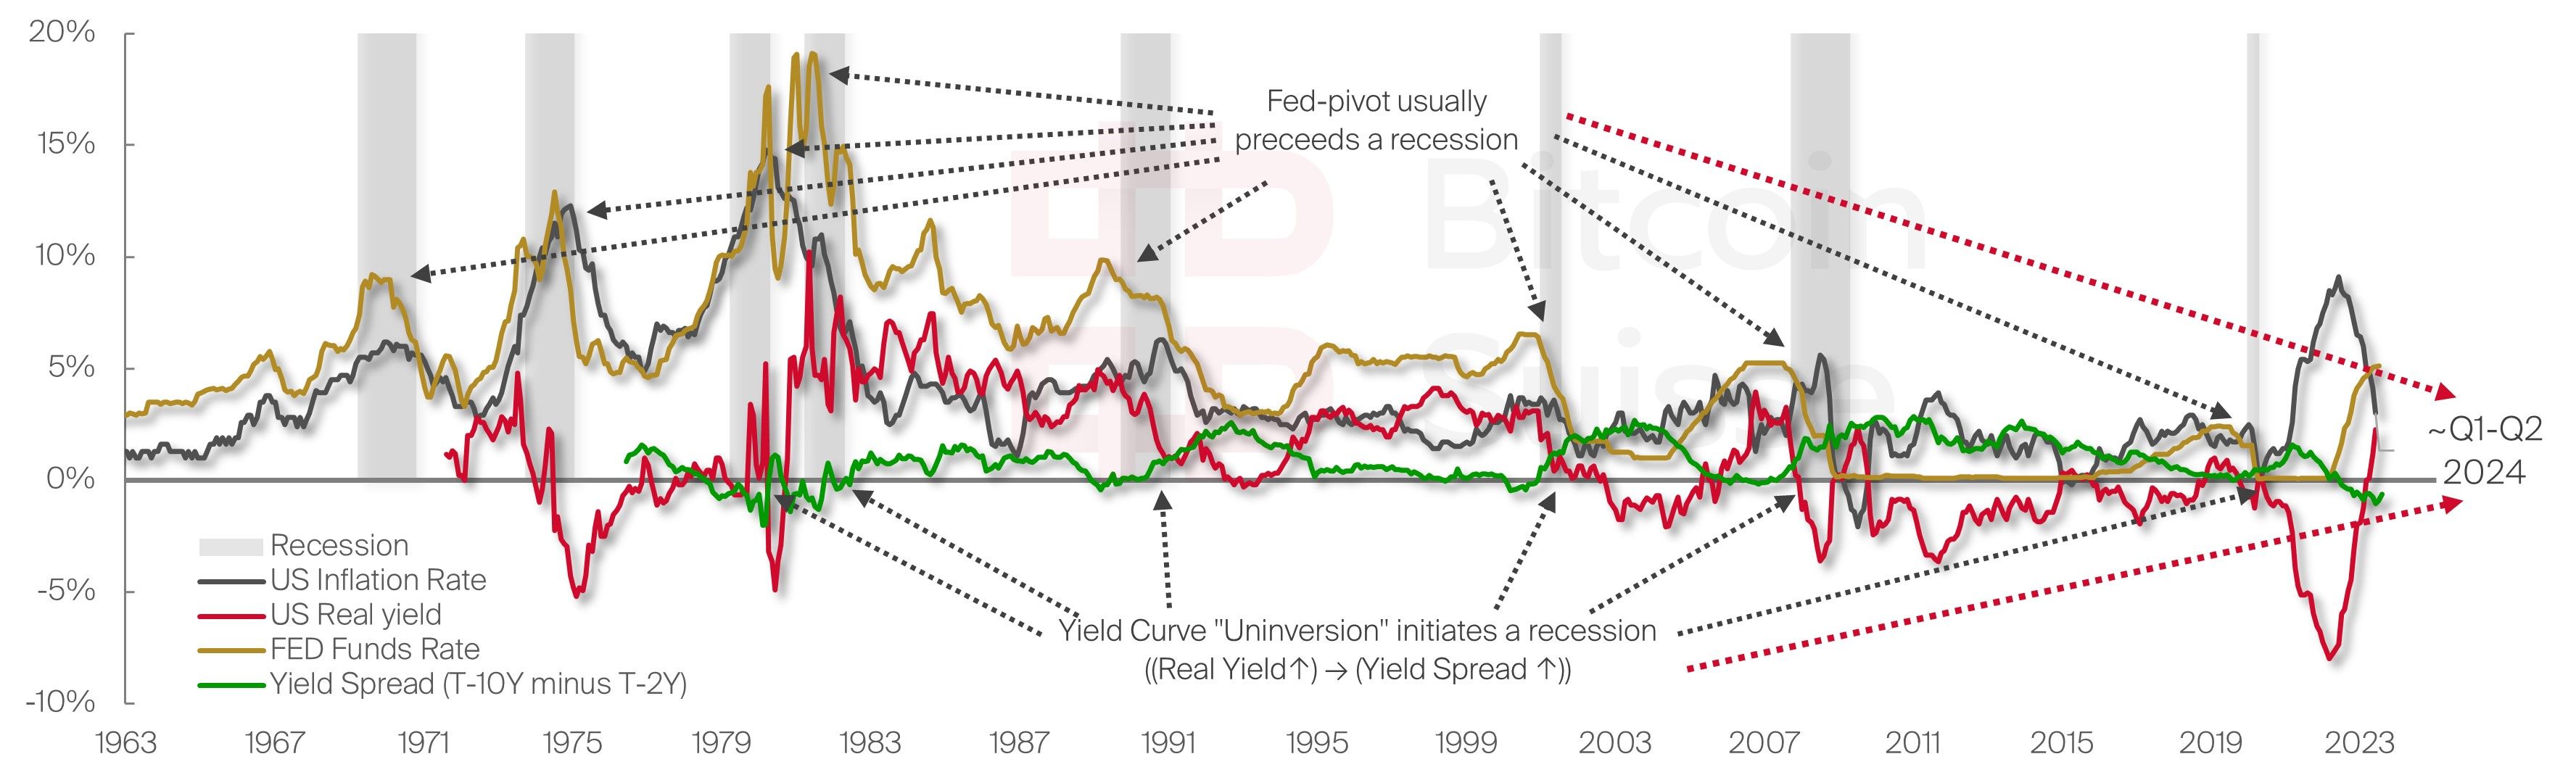
Our monetary conditions chart, introduced and analyzed throughout the first and third edition in depth, shows the development of fundamental monetary macroeconomic indicators that are major predictors of a recession. Though the inversion of the yield curve (yield spreads turning negative) is a leading recession predictor, it is the “Uninversion” of the yield curve, which usually initiates a recession. This is caused by real yields rising, and subsequently the yield spreads increasing as well, i.e., yield spreads turning to normal, positive territory again. Yield curve inversions preceded recessions in 90% of the cases, and economic downturns in the remaining 10% of instances since the Great Depression in 1929. A yield curve has never “uninverted” without either of these two scenarios playing out.
Given the current return to positive real yields, the largely debt driven system is starting to witness the economic pain that is induced by “real costs of debt”. The current FED funds rate policy is set for “higher for longer” and will add to this dilemma, as rate cuts are unlikely before the end of 2023, but rather likely around Q1/2024. Historically, the policy goal was to substantially suppress inflation (CPI) and core inflation (PCE), which excludes energy and food, which are both still elevated at this point. Since the labor market is currently still extremely robust, despite first cracks showing in the economic system, inflation is unlikely to retrace sufficiently, to meet the central banks´ policy targets soon, underpinning the “higher for longer” interest rate regime. Once the economic turmoil and labor market weakness materialize “sufficiently”, will be by the time that the yield spreads normalize. Consequently, the yield curve will “uninvert” and a FED pivot is imminent or implemented already. The most probabilistic time horizon for this to unfold is around Q1/Q2 2024.
The second scare
So far, our insights from Liquidity Conditions and Monetary Conditions all point in the same direction: economic turmoil and a “second scare” in the markets ahead of us is probable. To observe the full picture and derive even more evidence of what is likely to come, we will analyze 3x3 indicators on Sentiment, Financial Conditions and Economic Activity.
Sentiment
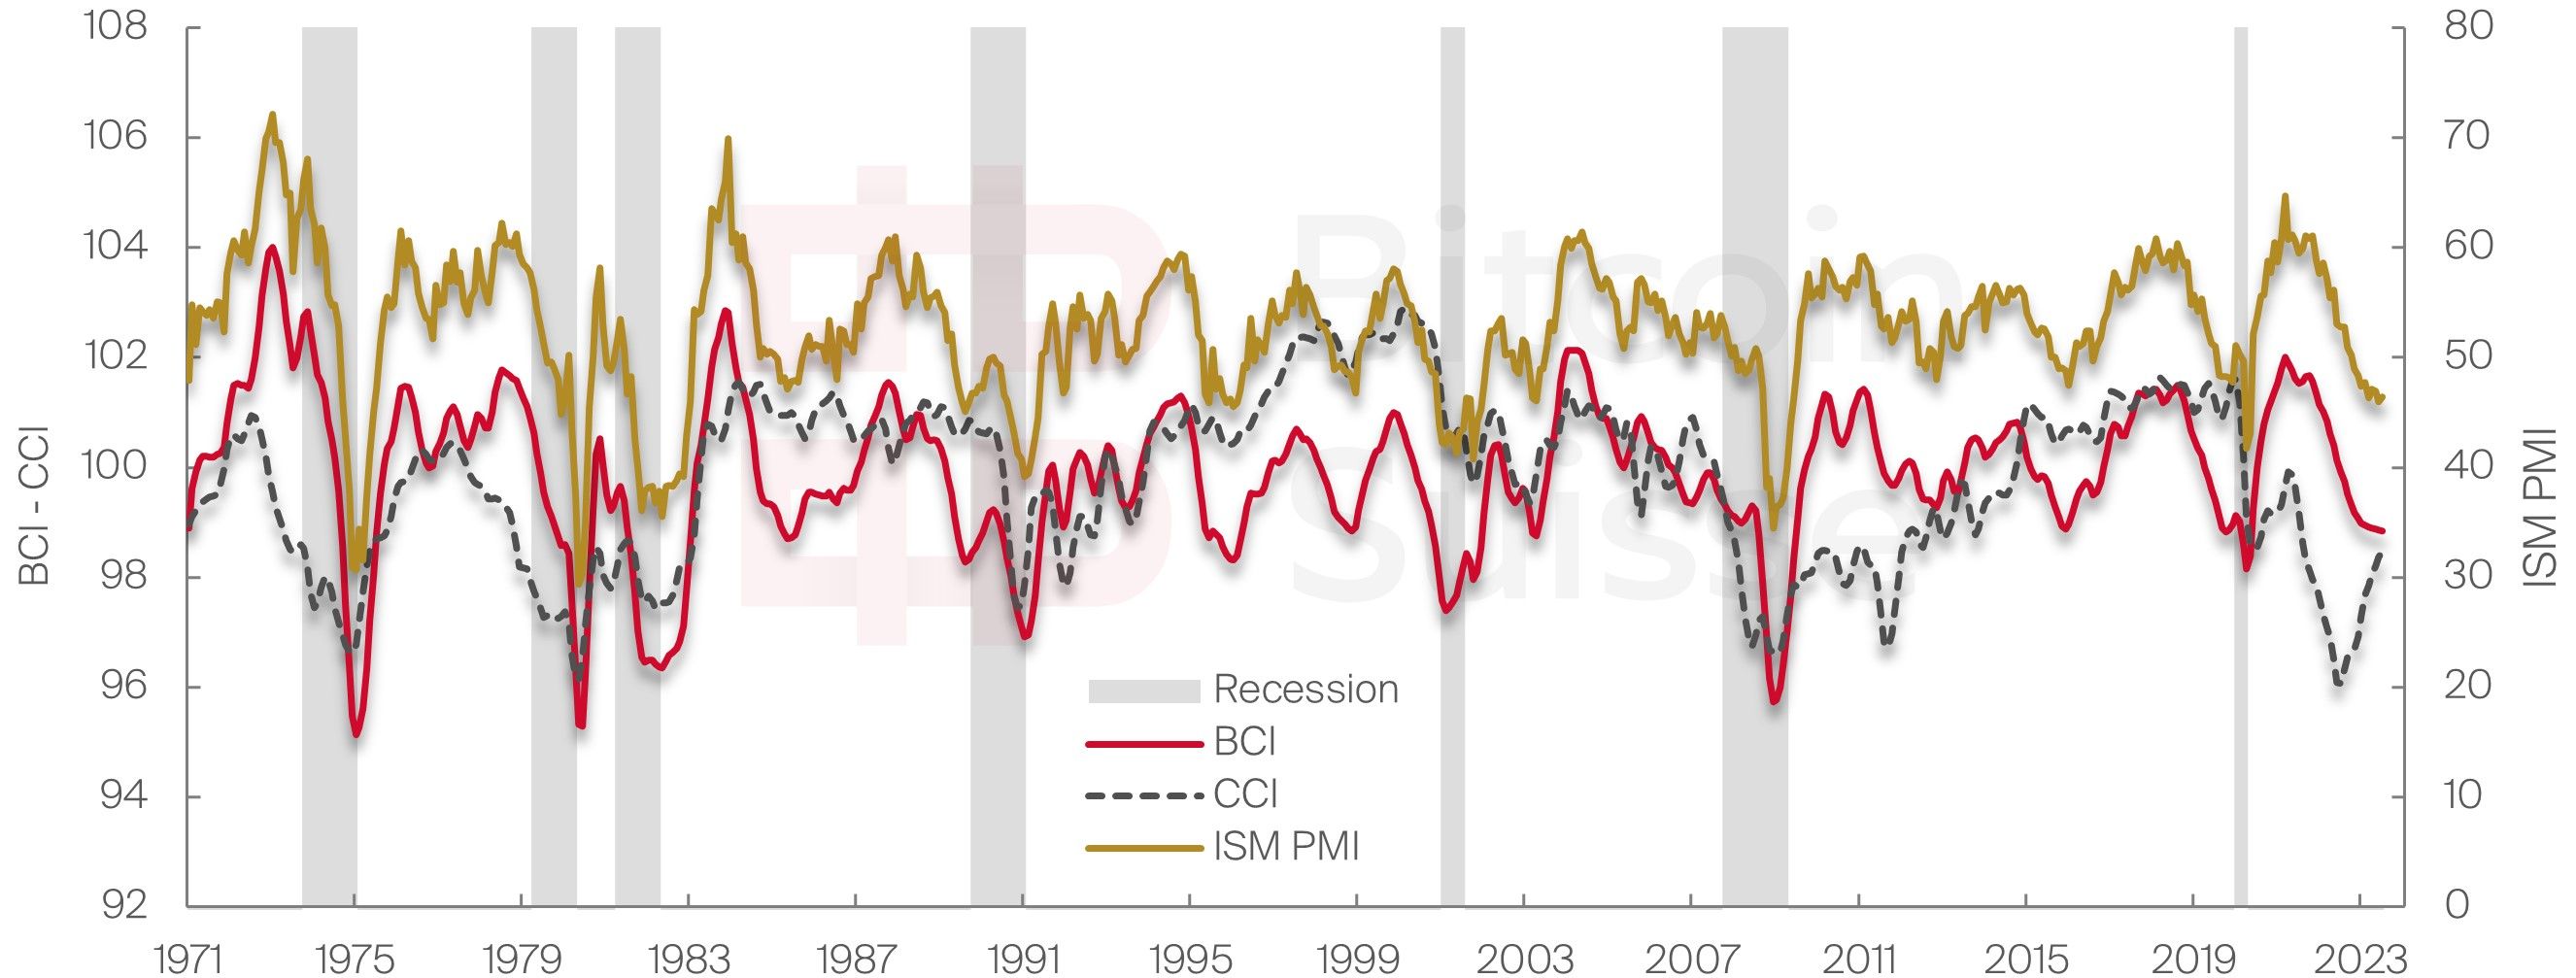
To gauge future economic developments, we track three sentiment metrics of businesses and consumers. The Business Confidence Index (BCI) captures developments in production, orders, and inventory to capture and anticipate future activity in output and economic activity, based on the sentiment of businesses. Similarly, the Consumer Confidence Index (CCI), measures the sentiment for consumers by aggregating unemployment, savings, or economic optimism/pessimism of consumers. The Institute for Supply Management’s (ISM) Purchasing Managers Index (PMI) measures the aggregate demand for products via orders, employment, prices, inventory etc. and indicates the overall sentiment and confidence among investors, consumers, and businesses. These three indices capture the aggregate sentiment of consumers, businesses and leading economic activity based upon the confidence of market participants.
Overall, it is only consumers, that are getting somewhat more optimistic than in the past, however, their “optimism level” barely recovered to the 2020 recession levels, so it should rather be termed as consumers becoming less pessimistic. Businesses and economic sentiment are still declining, nearing historical lows, indicating steadily contracting optimism while they are protecting their downside in an anticipation of economic weakness.
Financial Conditions
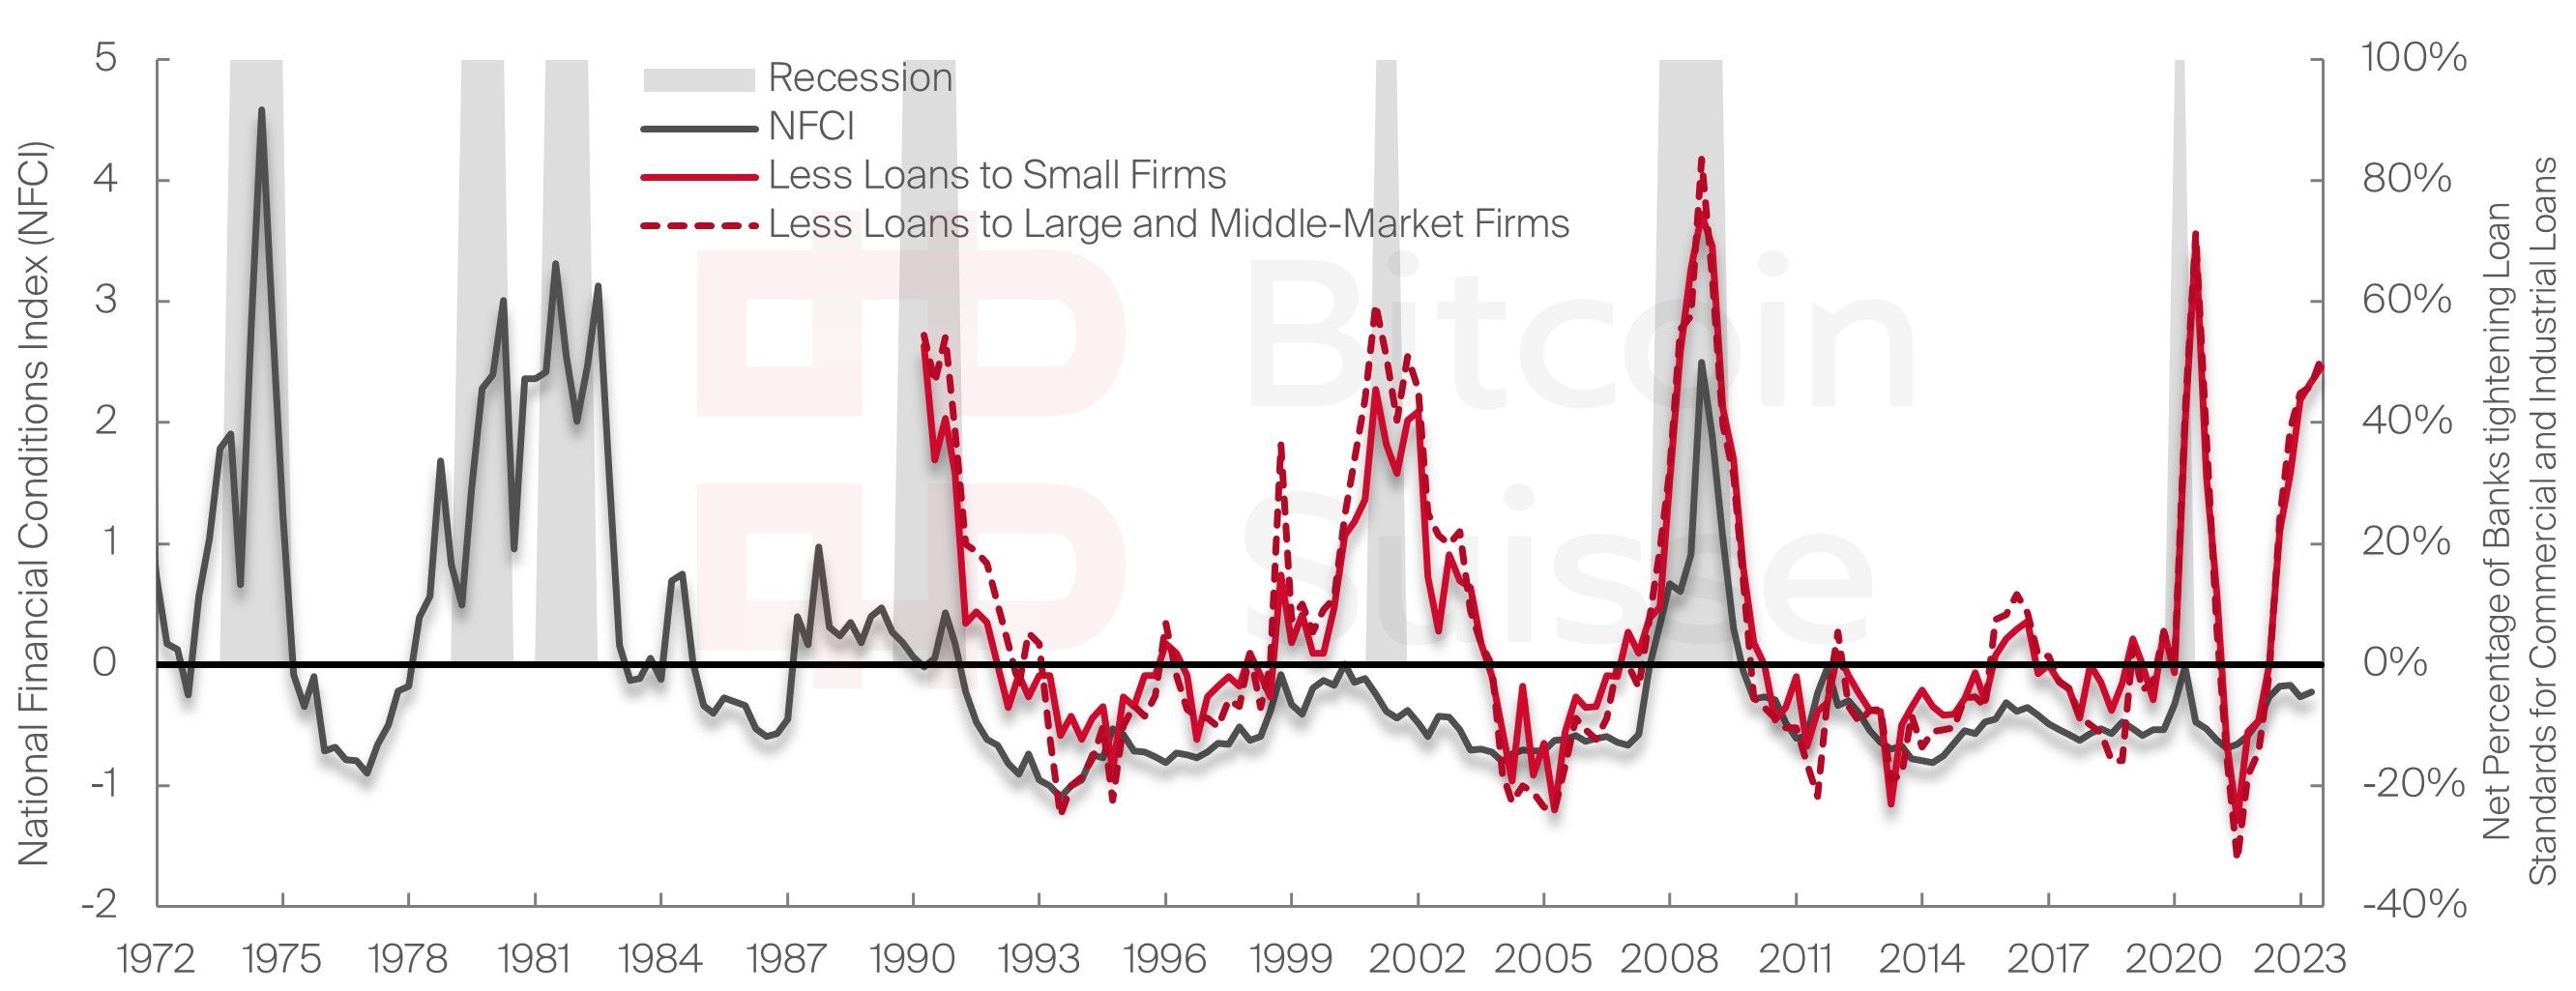
Through tracking financial conditions, we can measure the financial distress the economy currently finds itself in. The National Financial Conditions Index (NFCI) aggregates the financial conditions in equity, debt, and money markets, with an increasing index implying that financial conditions are tightening. Complementary we observe the net percentage of banks tightening loan standards for commercial and industrial loans to firms of all sizes. This can be thought of as a measure for the access to loans/liquidity to the entirety of companies in the economy. All things considered, firms have substantially limited access to liquidity and cash in the current economic regime. Though the general financial conditions are not significantly tightened yet, the broad economy is already in a liquidity shortage, at times when the real yield (cost of debt) is rising, and economic activity is contracting. Tight financial conditions and limited access to funding and liquidity for economic participants precede recessions and economic distress. With currently around half of all banks limiting their liquidity provisions to the economy the “tipping point” for further economic repercussions appears to be close.
Economic Conditions – Leading – Coincident - Lagging
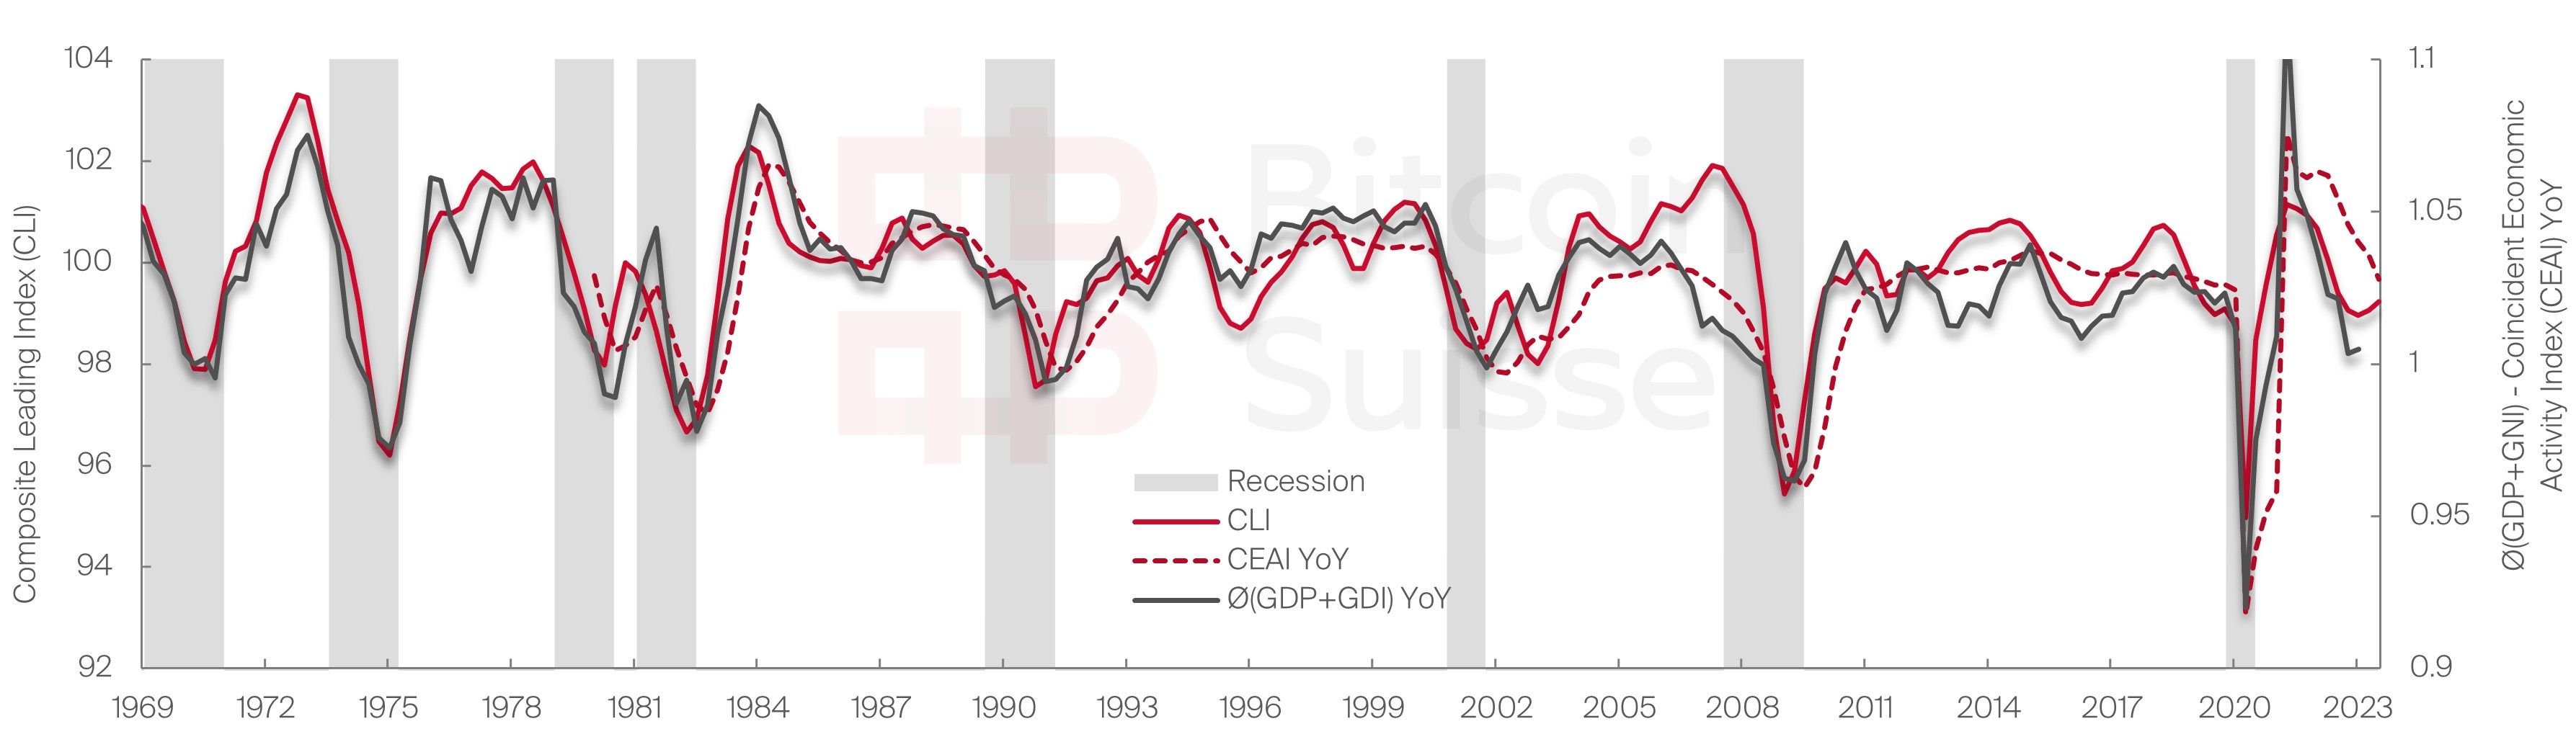
Assessing economic conditions and activity is performed with three proxies: leading, coincident, and lagging indicators. We can evaluate leading indicators to estimate what is likely to come, track coincident indicators as of today to gauge what the most probable current conditions are, and determine through lagging metrics what truly materialized at present in hindsight.
The Composite Leading Indicator (CLI) helps navigate the current and future stage of the business cycle and is composed of several economic indicators including business sentiment, industrial production, consumer confidence and other leading economic indicators. The current economic condition is measured by the Coincident Economic Activity Index (CEAI) which is composed of employment data, unemployment rate, hours worked in the economy and overall wage and salary data. Lastly, we can determine the actual economic condition that was present at a past time through the lagging economic indicator of the real average of gross domestic product (GDP) and gross domestic income (GDI). GDP aggregates the market value of goods and services produced through labor and capital, whereas GDI counts the total incomes and costs earned and incurred by the economy. In a “normal” economic equilibrium these two indicators should be equal, but in practice that is never the case, therefore we take a real average of the two.
The leading economic indicator predicts a stagnating and weakening business cycle ahead of us, with some evidence of a slowing of the downtrend. This slowing of the economy is reflected in the coincident economic indicator, which shows the consistent descend that is materializing. Lastly, the “true” lagging economic indicator shows that the real year-over-year (YoY) change in economic output and income is dropping substantially. All in all, economic activity is nearing historical lows and there is low momentum to support a near reversal.
In aggregate, our 3x3 indicators on Sentiment, Financial Conditions and Economic Activity, in conjunction with the Monetary Conditions and Liquidity Conditions support the hypothesis of a “second scare” taking place in the markets. Overall, we witness dropping sentiment levels, which fuel to fear and uncertainty in markets. Tightening financial conditions add to the current risk-off environment, while economic activity contracting increases the inflation and recession risk. Given that both equity and crypto markets currently trade at “historical best-case” valuations for bear markets (refer to “Is the Bottom in?” Version 2.0), and front-run global net liquidity substantially, sideways and downside price reversals towards cycle lows are likely and necessary to close the liquidity jaw.
Both crypto and equity markets find themselves in a risk-off environment, primed by the pre-election year and pre-halving year, while high yields and contracting liquidity add to the sentiment. Based on the data and indicators, the most likely confluence for the “second scare” and economic turmoil to materialize is around Q1/Q2 2024. The most probable scenario is that markets will revisit their cycle lows, whereas low performing equities and crypto assets, including altcoins further out the risk curve, have a good chance of making new cycle lows.
Crypto: The first to bottom?
Ever since its inception the crypto market developed and grew in cyclical swings and phases, which are at large decoupled from macro factors and traditional financial markets. Nevertheless, these phases get influenced and exaggerated to their respective extreme (hype phases and apathy phases) by macro factors. It is therefore crucial to understand the underlying dynamics that drive and amplify the respective cycles and phases of the crypto market.
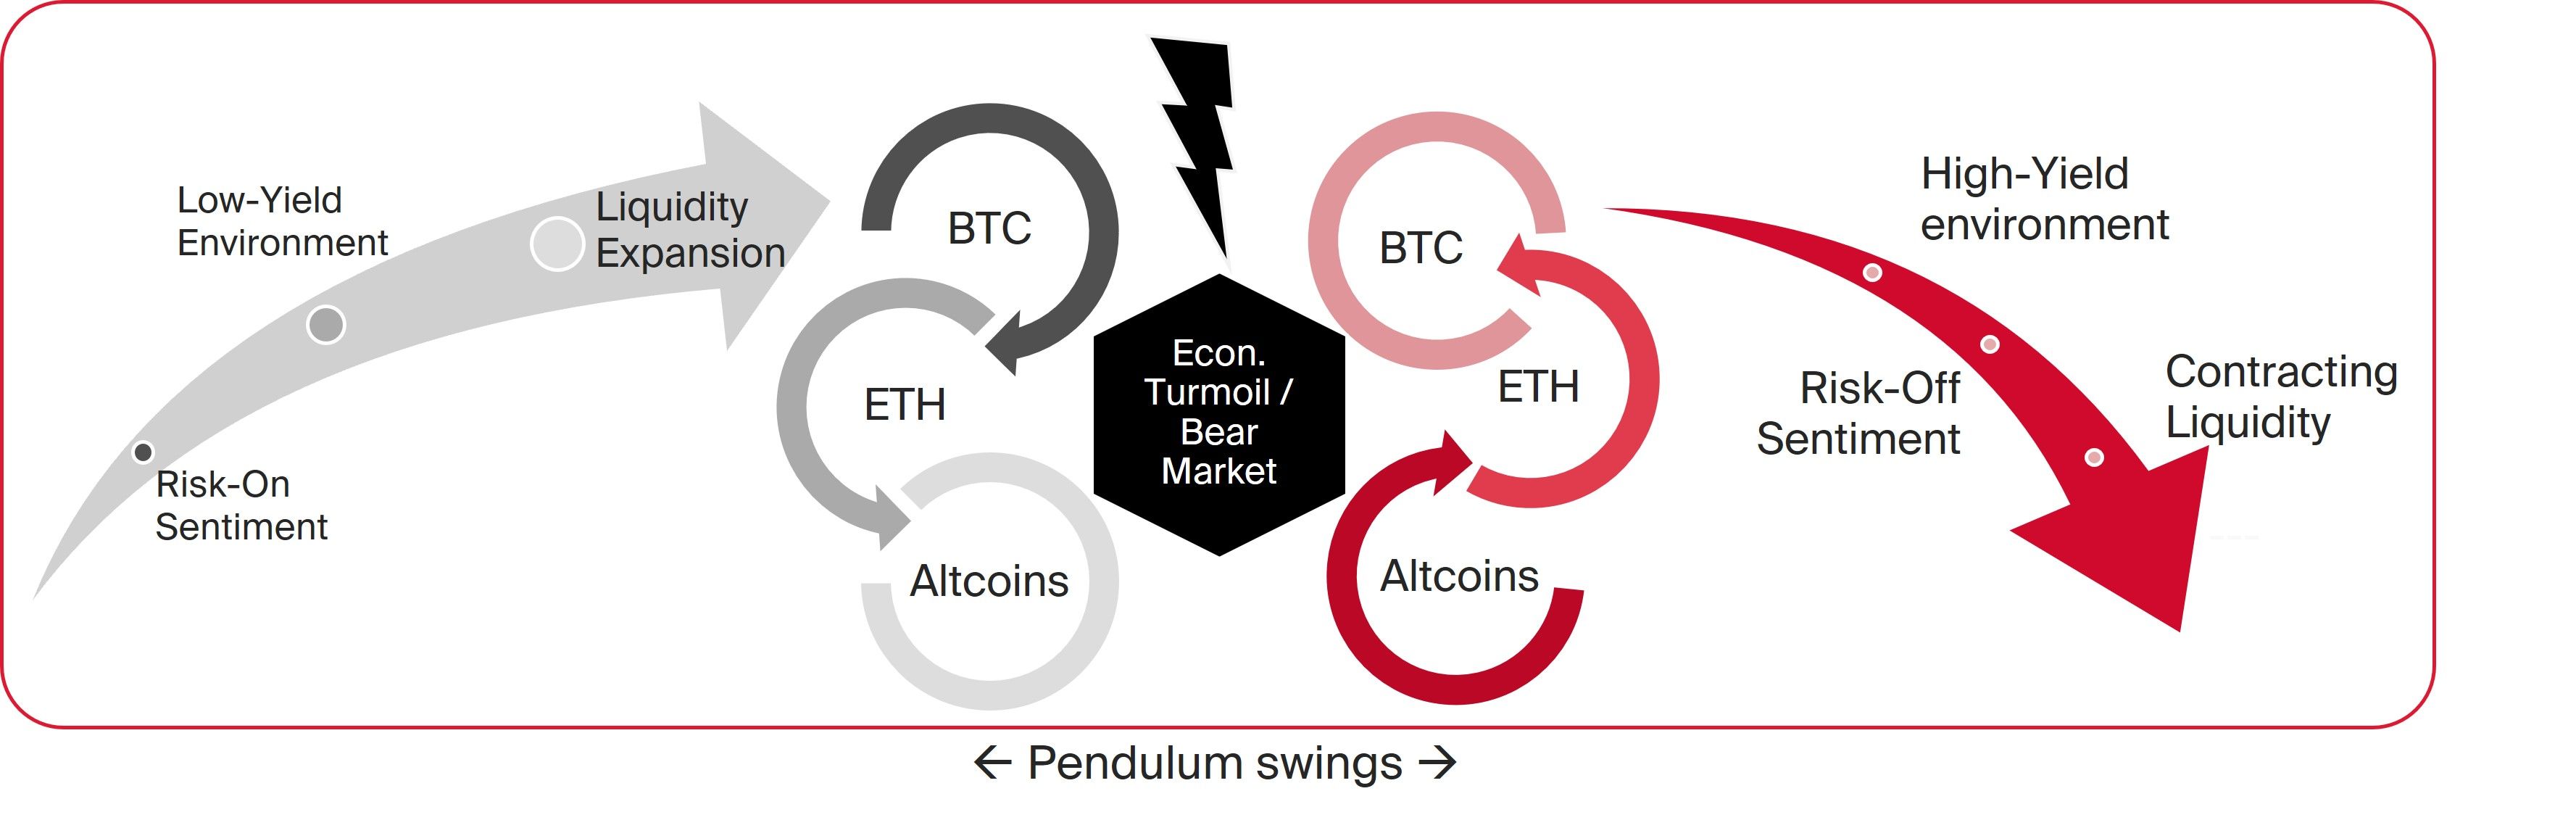
As displayed below, once we find ourselves in a generally optimistic, risk-on sentiment, accompanied by a low-yield environment and most crucially expanding liquidity and broad money expansion, liquidity flows into the crypto markets. Liquidity enters the crypto asset class through BTC mainly, and funnels down to ETH, and altcoins further out the risk curve later. However, once we hit the bear market and/or economic turmoil and recession stage in the cycle, these dynamics reverse 180 degrees. Liquidity flows out of altcoins and into safer assets such as ETH, and BTC especially, and even out of the crypto market entirely. This dynamic is fueled by a high-yield environment and risk-off sentiment, which make the risk premia in crypto assets unattractive and potentially even too low. This gets amplified by contracting liquidity simultaneously, adding to the current apathy in crypto markets. However, the pendulum swings from one side of the spectrum to the other, which implies that the biggest threat to crypto currently, is also its antidote: liquidity. Crypto is a function of excess liquidity, and therefore extremely sensitive to underlying changes in liquidity. The implications resulting from the described dynamics are that once “enough” economic turmoil has materialized, and liquidity will again get injected into markets, crypto has the potential to react as a first. Consequently, crypto prices are likely to recover and rally almost in lockstep once Global Net Liquidity increases and the broad money base gets expanded further. Equity markets on the other hand are more connected to actual economic activity, implying that they are slower to react to liquidity injections and more dependent on economic activity picking up first.
Final Assessment
Our global macro analysis yielded that the “second scare” will likely occur during Q1/Q2 2024. This is based on a full assessment of tight liquidity and monetary conditions. On top of that, high yields, risk-off sentiment, and economic activity contracting support the hypothesis of economic headwinds and/or a recession unfolding in the next 12-18 months. From the crypto market analysis, we know that the dynamics driving crypto markets are currently on the unfavorable side, of high-yield, risk-off sentiment coupled with contracting liquidity. We are expecting to see liquidity flowing out of crypto assets in the interim, with altcoins likely witnessing new cycle lows, and losing substantial dominance. In contrast, BTC has the lowest chance of making new cycle lows, whereas ETH has a not insignificant likelihood of making a new cycle low.
But should we be scared? Against all odds, and despite the “second scare” probably materializing around Q1/Q2 2024, it is what happens once the “second scare” unfolds that is of concern.
As soon as the system and the economy show sufficient cracks and the “second scare” materializes, will most likely coincide with the point in time where monetary and liquidity conditions are being eased again. The historical rule of thumb has been that the worse it gets, the more must be eased subsequently. This implies that liquidity needs to be injected into the system, causing economic activity and prices to pick up once again and leading to the recovery. This tide of liquidity inflows will lift all boats, and crypto will likely lead the way of recovery, due to its sensitivity to liquidity. This process continues, until the system has been overflown with liquidity and cheap money once again, subsequently showing cracks and we will find ourselves back again in the current regime before the cycle starts all over again. – But will crypto lead to a more balanced and less debt driven and liquidity dependent system in the future?!
Table of Figures
Figure 1: (Chart) Bitcoin Suisse (Data) Bureau of Labor Statistics, Federal Reserve, Federal Reserve Bank of St. Louis, World Bank
Figure 2: (Chart) Bitcoin Suisse (Data) Cryptocap, BTC Index, – TradingView
Figure 3: (Chart) Bitcoin Suisse (Data) Federal Reserve Bank of St. Louis, SP, Global Net Liquidity – TradingView
Figure 4: Figure 2: (Chart) Bitcoin Suisse (Data) Bureau of Labour Statistics, Federal Reserve, Federal Reserve Bank of St. Louis, World Bank
Figure 5: (Chart) Bitcoin Suisse (Data) OECD, Intitute for Supply Management – TradingView
Figure 6: (Chart) Bitcoin Suisse (Data) Federal Reserve Bank of St. Louis, Chicago FED – TradingView
Figure 7: (Chart) Bitcoin Suisse (Data) Federal Reserve Bank of St. Louis – TradingView
Figure 8: (Chart) Bitcoin Suisse (Data) Bitcoin Suisse
Denis Oevermann
Investment Analyst / Crypto Researcher